Table of Contents
Evaluation Consideration and Evaluation Measures. 2
Data Collection and Evaluation Measure Scores. 6
Metrics for Evaluation Methods. 6
Value Calculations and Sensitivity Analysis. 6
Sensitivity Analysis Approach. 7
Results of the Sensitivity Analysis. 11
Problem Statement
One of the most influential parameters in the performance of a business is the decisions made by the executive. Conceptually, the performance of a business can be evaluated using different metrics including examination of the profits made, revenue generated, customer satisfaction, assessment of how well the business is performing towards meeting its objective. In practice, the evaluation of how well a business is performing requires the use of more than a single metric (Looy & Shafagatova, 2016). The question of which metric to adopt in evaluating the performance of XYZ is central to the analysis objective of the current report. In general, the problem of the business as of the moment is to:
- Examine at which stage over a specified period does the company start making profits from the sales of the company’s product
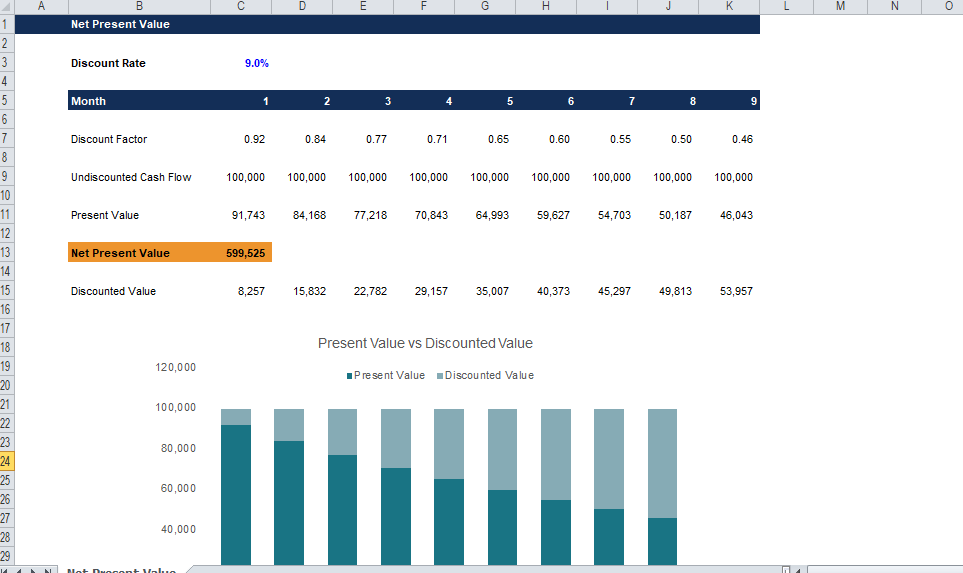
- Determine the value the discount given to the company adds to the business. That is, evaluate the profitability of the business’s product promotion in terms of increasing the cash inflows
- Forecast the sales that will be made by the different plants in the subsequent month
Currently, the business objective is to brainstorm practices that can be used to increase the company’s profitability. The preceding problems are classical business performance evaluation problems which ideally can be addressed using break-even analysis methods, net present value, and forecasting methods such as moving averages, trend projection, and Trend adjusted exponential smoothing (TAES).
Evaluation Consideration and Evaluation Measures
Evaluation Consideration
The choice of our analysis frameworks (i.e. three frameworks since we are addressing three business problems) will be informed by the nature of the organization and the context in which XYZ operates (Nordmeyer, 2019). For the sake of familiarity, we know that XYZ manufactures its product out of 5 different plants in the United States after which the product is shipped from the respective plant to the corresponding distribution point from where it is shipped to retailers who conduct sales as they see fit. The retailers can use other middlemen or make direct sales. Sales choices made by the retailers do not affect the sales made by the company at least not directly. However, other aspects such as the amount of discount given by the business are hypothesized to influence the number of products ordered by the retailers and subsequently influence the pricing of the product by the retailers.
Production of the products requires some fixed and variable costs. Some of the variable costs incurred by the business include packaging, cost of raw materials, taxes, direct labor etcetera while fixed costs include rent, salaries, and/or loan repayments. Both the variable and fixed costs are hypothesized to influence the revenue generated by the business hence will be taken into consideration.
The current only incorporate a few aspects of the business operations while excluding features such as the return to marketing investment which might have played an important role in the variations recorded in sales across the 5 markets in which the business operates. The inclusion of return on marketing investment would have provided a good measure with which to evaluate the marketing campaigns that work well for the company.
Evaluation Metrics
Our evaluation will focus on three main metrics i.e. sales, revenue, and profits (Laidlaw & Rojas, 2015). These three metrics can be viewed as interlinked or independent depending on the analysis perspective. The sales metric is independent of revenue and profits but depends on marketing effects and external competition. On the other hand, revenue depends on the number of sales made as well as the pricing per unit for each of the units sold while profits are dependent on sales, revenue and total costs incurred during the entire business period.
Therefore, if varying a parameter leads to an increase in sales, revenue, or profits, then the parameter in question be it increasing the price per unit, handling variables costs in such a way that they decrease is the best option to consider for the given scenario. In summary, any variation in a parameter is aimed at maximizing the gains function while minimizing the cost function.
Decision Alternatives
Below are the original business objectives:
- Examine at which stage over a specified period does the company start making profits from the sales of the company’s product
- Determine the value the discount given to the company adds to the business. That is, evaluate the profitability of the business’s product promotion in terms of increasing the cash inflows
- Forecast the sales that will be made by the different plants in the subsequent month
Referencing our earlier discussion, our objective is to generally provide a decision-making criterion that can be used to address the original business questions. To address the above problems, we will explore the effect of making decisions such as increasing product discounts, increasing or reducing the price, or cutting costs to boost revenue retained by the company.
Other alternatives would be to increase the number of days that the call center operates from 5 to 6 or increase the hours from 8 to 10. Using this alternative and the observation regarding the sales generated through the call center, we hypothesize that more sales can be made, increasing the revenue, and subsequently increase the profits that are generated.
The final set of alternatives used in our decision analysis include:
- Increase the prices of the products by $2 and reduce the cost of shipping incurred by the customers by $5
- Increase the discount offered to retailers as a marketing incentive
- Reduce the variable costs incurred by the business by offering overtime payments instead of employing new workers
Value Function Assessment
The general procedure for assessment is:
- Determine the appropriate analysis criteria e.g break-even analysis to determine the point where the business starts being profitable
- Add data to the analysis space
- Apply the correct formula for the current analysis technique
- Report on the findings
- Make a decision based on the findings
Scenarios
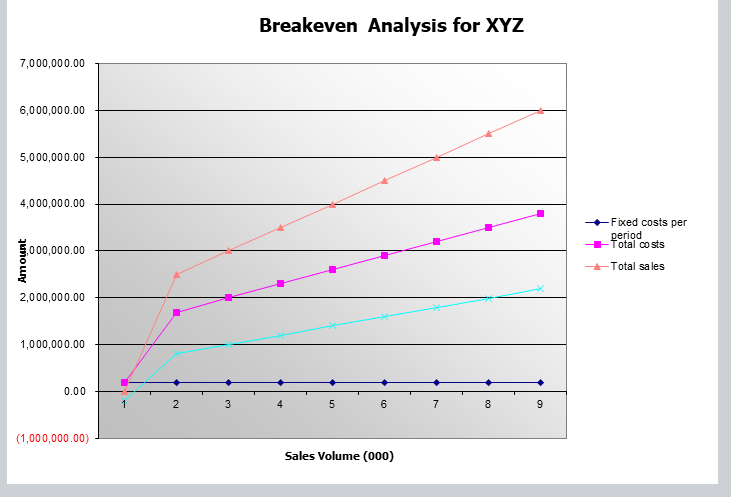
Scenario 1
Currently, the customers are expected to contribute at least 25 dollars for all the ordered products. Each unit is sold at 100$ irrespective of the goods ordered. However, the more goods the retailer orders the higher the discount. The maximum discount allowed is 9%. How does increasing the price per unit affect the breakeven analysis results?
Scenario 2
The company currently pays each caller $240 for an 8 hour day for 5 days in a week and 52 weeks a year except for when the caller takes days off or during their vacation days. Is increasing the payment for each caller better than employing new callers for the extra proposed shifts?
Scenario 3
Assuming the company sells 200,000 units in 9 months, while the price increase by$2, and the variable costs decrease by 2%, how many units are needed to make a profit of $2,000,000.
Data Collection and Evaluation Measure Scores
Data used for this study is hypothetical based on the observed distribution of the original dataset that was included alongside the problem definition.
Metrics for Evaluation Methods
For each decision that we make, it is prudent that they are informed by optimal results which can only be obtained using optimally performing models and analysis approaches. Since one of our proposed evaluation approaches is forecasting, we will implement 3 forecasting models and select one which performs optimally in forecasting the sales for each of the 5 business plants in the 5 markets in which they operate.
In particular, we used model performance evaluation metrics such as Mean absolute percentage error (MASE) which is a measure of the prediction accuracy of the respective forecasting method. Other metrics include median absolute deviation (MAD), “…measure of the variability of a univariate sample of quantitative data” using this statistic we will be able to measure the difference between the actual sales values and the average sales values. The lower our MAD value, the more we can observe that the mean sales are representative of the sales made in that region.
Value Calculations and Sensitivity Analysis
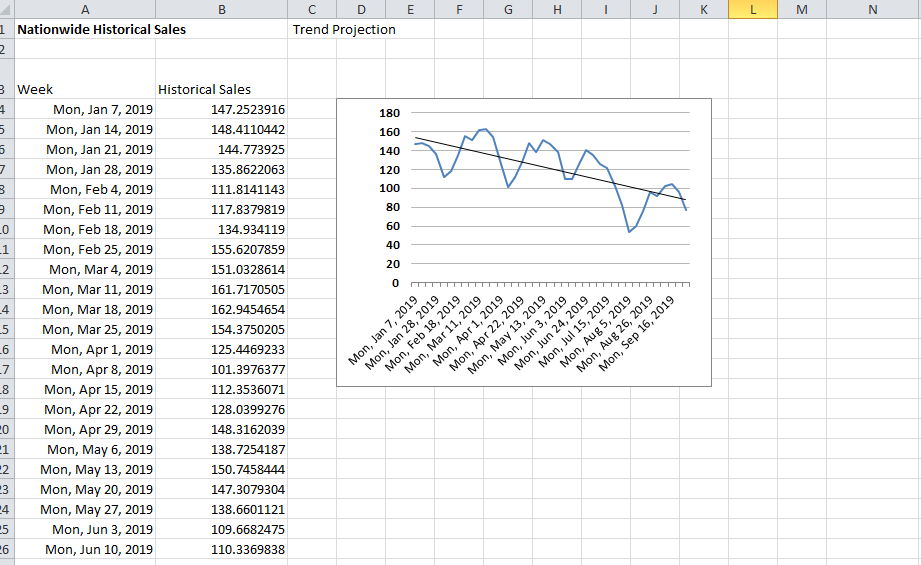
Forecasting
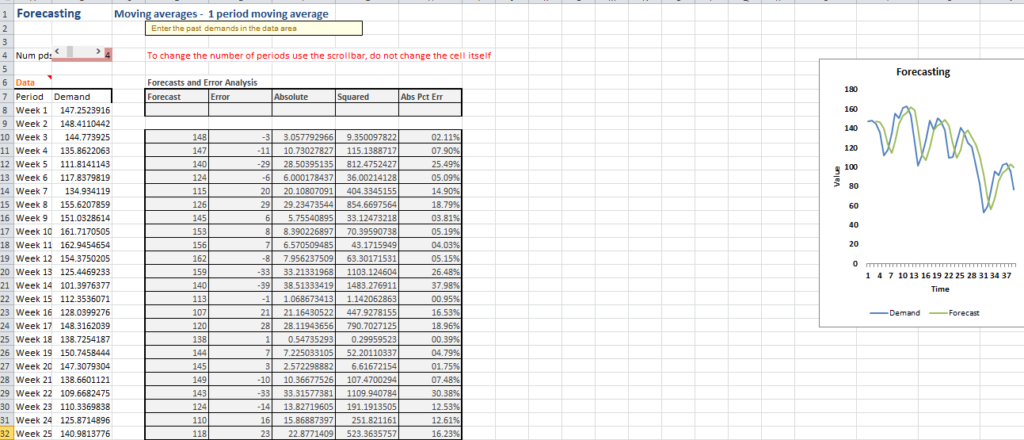
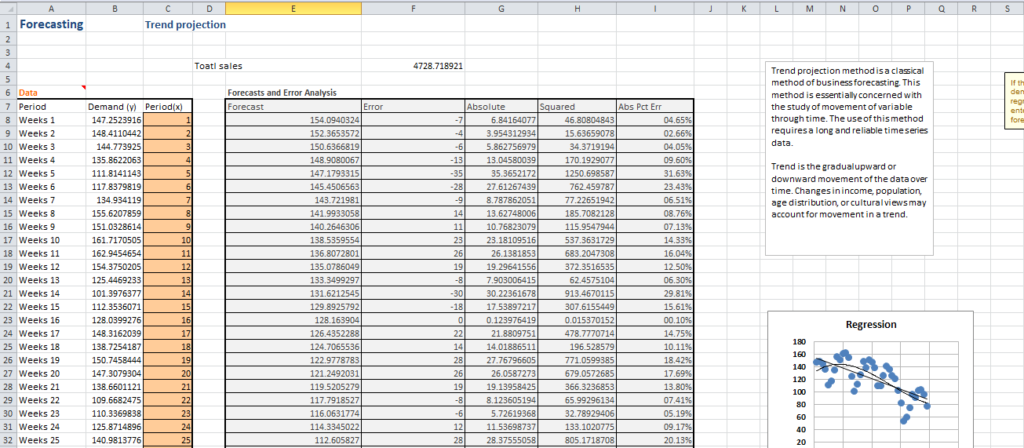
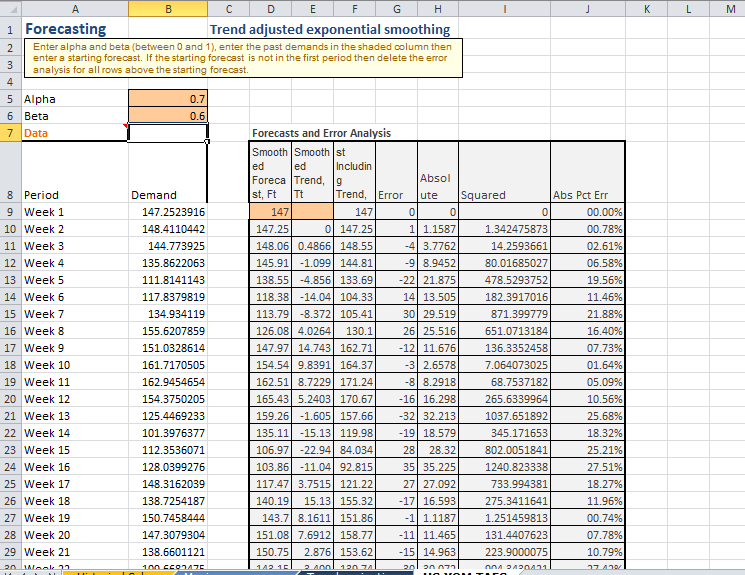
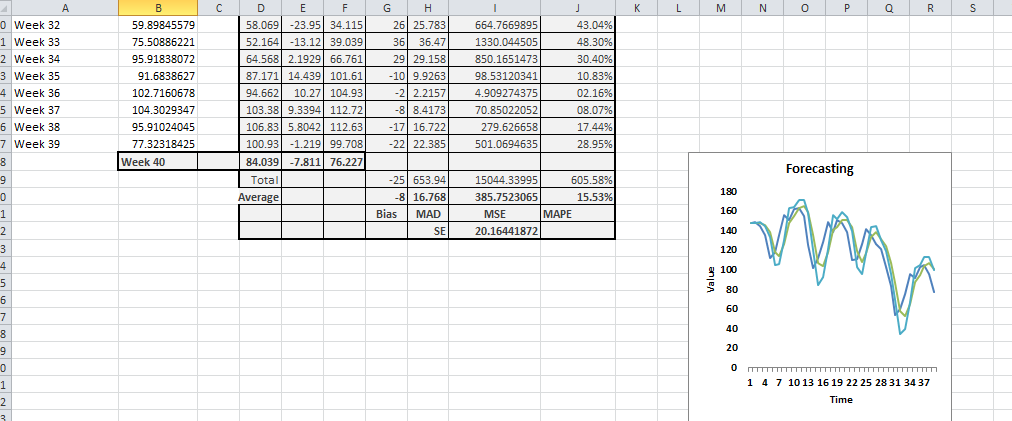
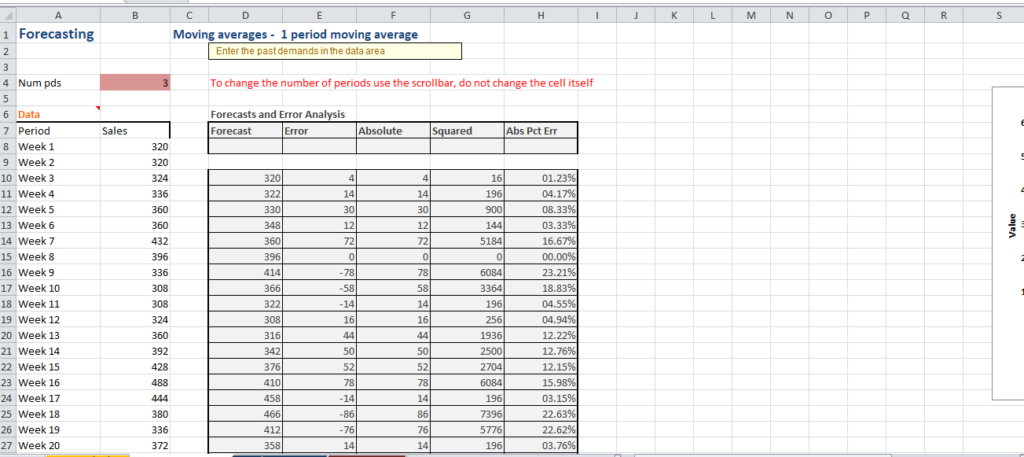
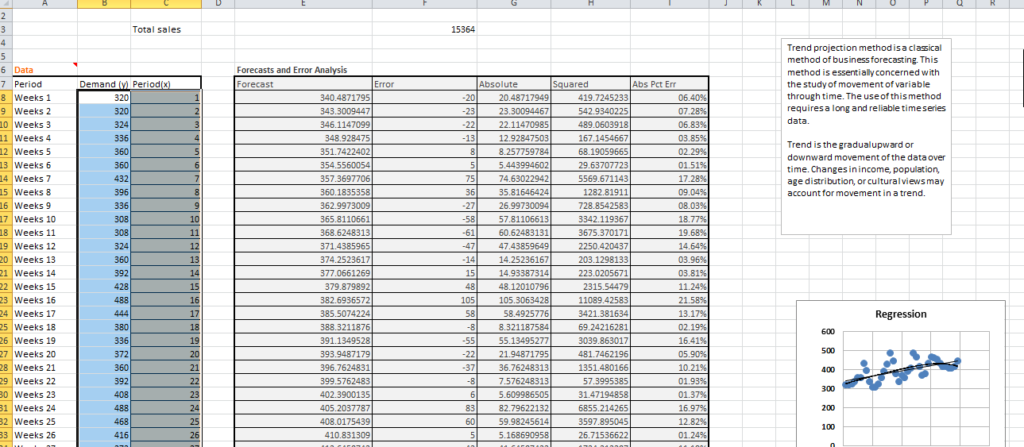
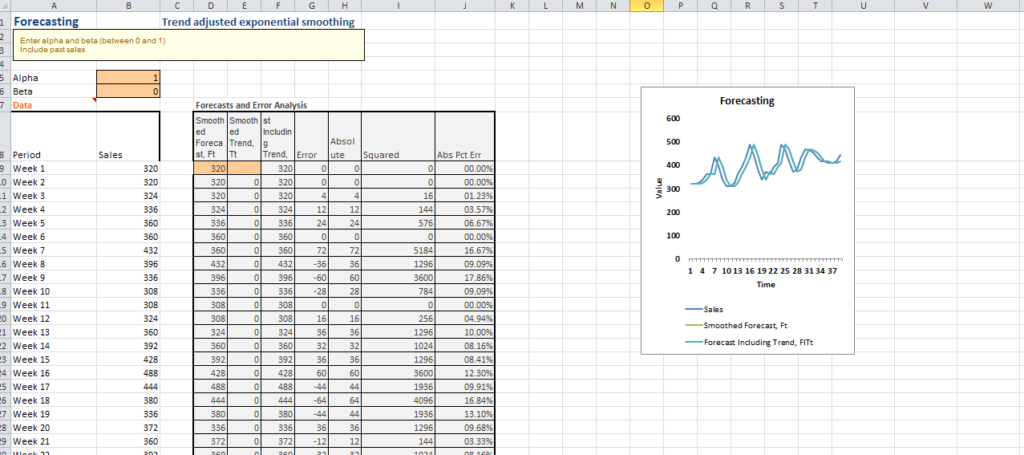
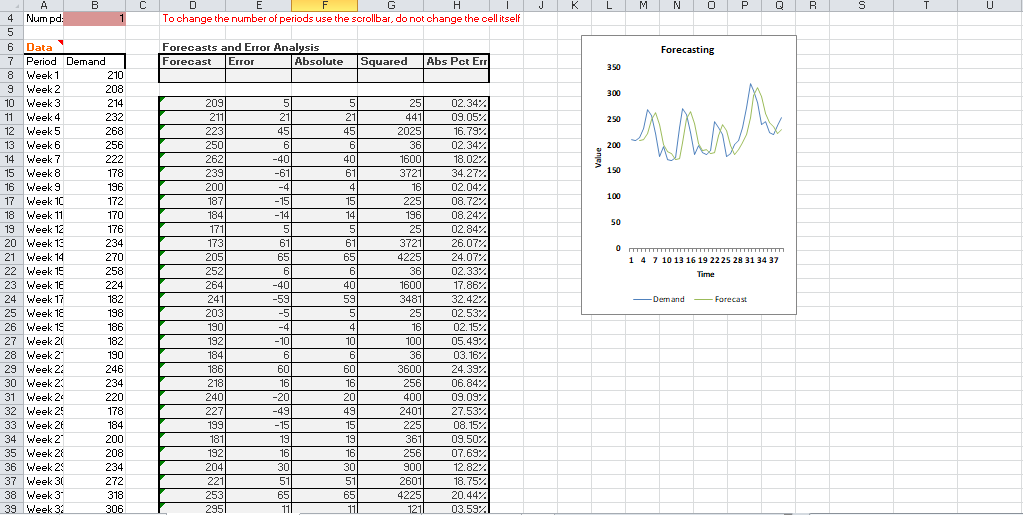
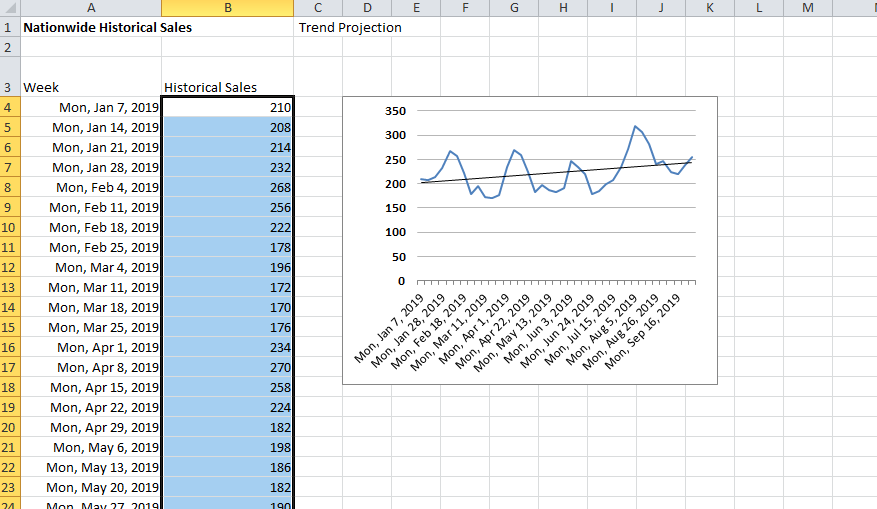
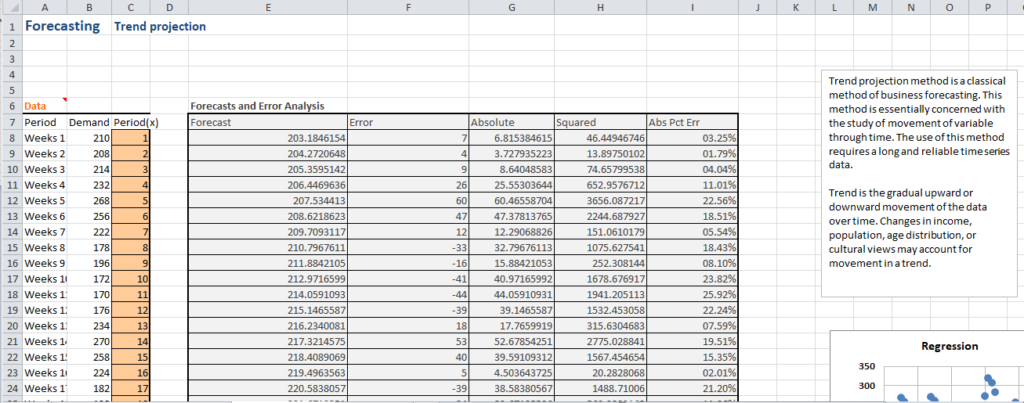
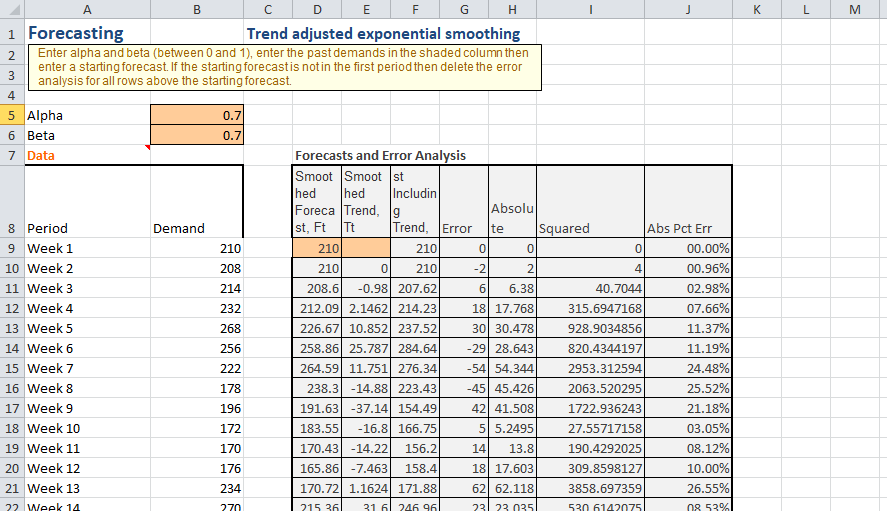
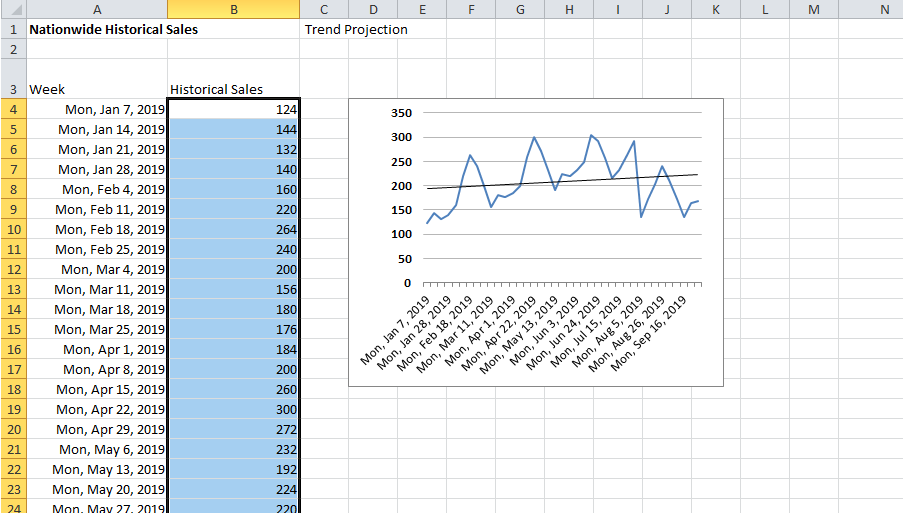
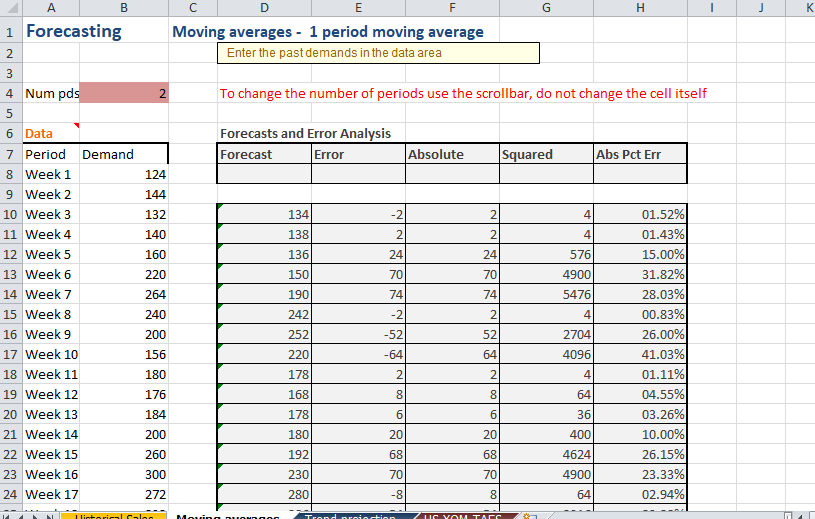
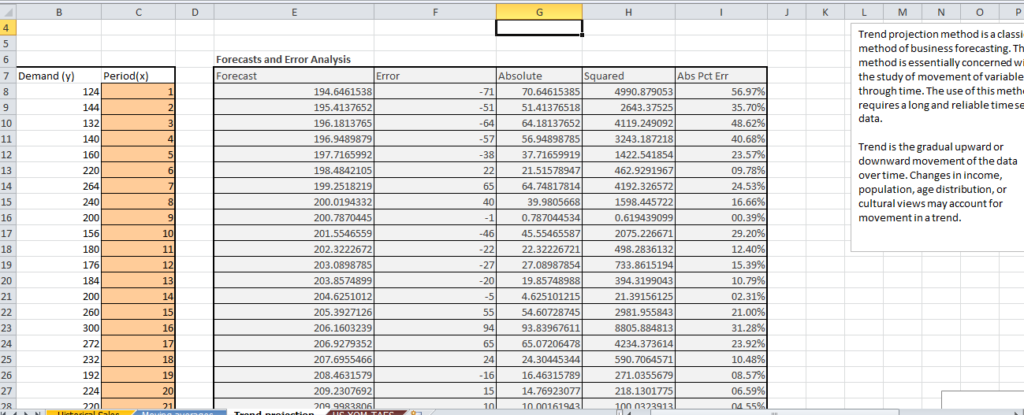
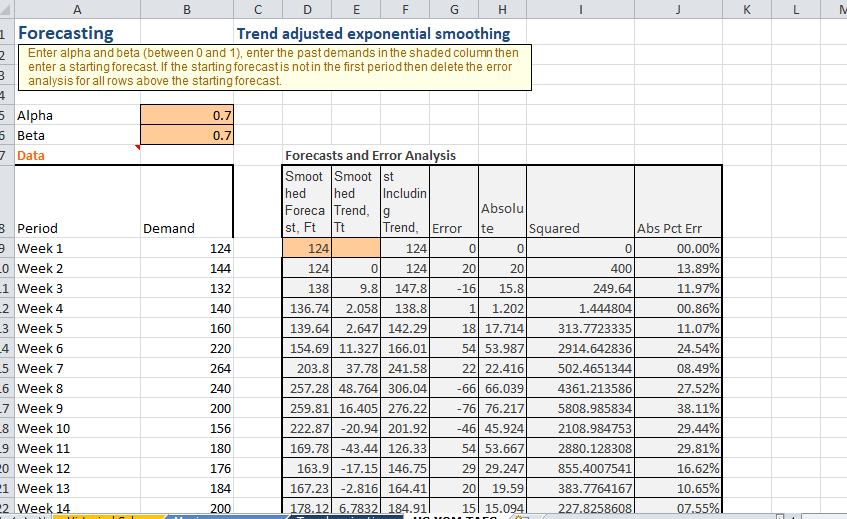
We implemented three forecasting models i.e. moving averages, trend projection, and Trend adjusted exponential smoothing. During our model implementation, we used 5 different excel sheets to conduct forecasting for each of the 5 markets and evaluated the performance of each of the forecasting models using MAPE, and MAD. For the Moving average, we used a 1-point moving average which involves summing the sales over a given period then dividing by the sum of the total number of periods. We defined alpha for the TAES using alpha and beta as the smoothing constants for the series level and trend respectively For trend analysis, we implemented a linear regression analysis approach. See appendix 1 for the forecasting analysis results for each of the markets as predicted by the Moving average model which was the best performing model with the lowest MAPE across all the markets.
Sensitivity Analysis Approach
Since we observed that increasing the product price increases revenue and does not affect sales, all our analyses using Excel ™, we defined conducted a sensitivity analysis for each different product prices and evaluated the effect on returns and profit (see appendix 2).
Conclusions
Forecasting
To ensure that we chose the best model for forecasting, we implemented three models which include moving averages, trend projection, and Trend adjusted exponential smoothing (TAES) after which we examined how well the models performed in forecasting sales for October. The moving average model returned the lowest MAPE for each of the markets’sales prediction for two subsequent weeks hence its results were used to indicate the sales forecasts for the two weeks in October. Table 1 below shows the October forecasts for each market
Table 1
| Market | Week 1 Forecast | Week 2 Forcast |
| Dallas | 410 | 412 |
| Minneapolis | 222 | 229 |
| Los Angeles | 1396 | 1420 |
| Philadelphia | 152 | 150 |
| Atlanta | 102 | 100 |
| Total Forecasted Sales | 2282 | 2311 |
Sensitivity Analysis
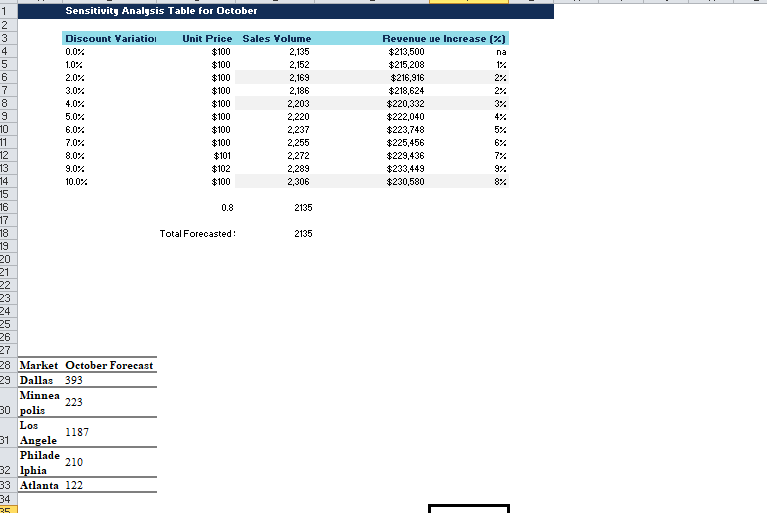
From our sensitivity analysis, we note that using the total forecasted sales for October, increasing the unit price for the product by $1 is projected to increase the sales volume from 2135 to 2272 while the revenue is projected to increase by 1% to 7% from the original 6%. On the other hand, increasing the discount by 2% and the unit price by $2 increases the sales to 2,289 and the revenue by 3% to reach a 9% revenue increase. However, increasing only the discount from say 9% to 10% increases the number of sales made to 2,306 which is higher than when the discount is 9% but the revenue only increases by 2% (see appendix 2).
Based on these observations, it is evident that increasing the percentage of discount offered to the retailers helps increase the volume of sales by a relatively large margin but only increases the revenue by a relatively slight margin. However, increasing the prices increases the sales volume by a slight margin while the revenue increases by a relatively he margin.
Using these observations, the executive can decide whether to only increase the discount which increases sales and with a slight revenue increase or increases the discount and price which increases the revenue slightly higher but with relatively fewer sales.
References
Laidlaw, J., & Rojas, K. (2015, January 30). Evaluating the Performance of an Organisation. From Better Evaluation: https://www.betterevaluation.org/en/theme/organisational_performance
Looy, A. V., & Shafagatova, A. (2016). Business process performance measurement: a structured literature review of indicators, measures, and metrics. Springerplus, 5(1), 1797.
Nordmeyer, B. (2019, March 23). Considerations in a Manager’s Performance Evaluation. From Chron: https://smallbusiness.chron.com/considerations-managers-performance-evaluation-64732.html
Appendix
Appendix 1
Minneapolis
Moving Average (MA)
| Average | 2 | 27.58333333 | 1177.194444 | 12.17% | |||
| Bias | MAD | MSE | MAPE | ||||
| Next period | Predicted Sales | SE | 34.7969621 | ||||
| Week 40 | 226 | ||||||
| Week 41 | 229 |
Dallas
MA
| Average | 5 | 35.66666667 | 1996.888889 | 08.99% | |||
| Bias | MAD | MSE | MAPE | ||||
| Period | Sales Prediction | SE | 45.32044635 | ||||
| Week 40 | 410 | ||||||
| Week 41 | 412 |
Philadelphia
MA
| Average | 1 | 36.32432432 | 2215.783784 | 18.01% | |||
| Bias | MAD | MSE | MAPE | ||||
| Next period | Predicted sales | SE | 48.39834708 | ||||
| Week 40 | 152 | ||||||
| Week 41 | 150 |
Los Angeles
MA
| Average | 29 | 205.7916667 | 63858.3125 | 16.98% | |||
| Bias | MAD | MSE | MAPE | ||||
| Next period | Predicted sales | SE | 256.286628 | ||||
| Week 40 | 1,396 | ||||||
| Week 41 | 1,420 |
Atlanta
MA
| Average | -3 | 15.58091553 | 366.4139507 | 15.02% | |||
| Bias | MAD | MSE | MAPE | ||||
| Period | Sales Prediction | SE | 19.68125735 | ||||
| week 40 | 102 | ||||||
| week 41 | 100 |
Appendix 2
Results of the Sensitivity Analysis
| Discount Variation | Unit Price | Sales Volume | Revenue | Revenue Increase (%) |
| 0.0% | $100 | 2,135 | $213,500 | na |
| 1.0% | $100 | 2,152 | $215,208 | 1% |
| 2.0% | $100 | 2,169 | $216,916 | 2% |
| 3.0% | $100 | 2,186 | $218,624 | 2% |
| 4.0% | $100 | 2,203 | $220,332 | 3% |
| 5.0% | $100 | 2,220 | $222,040 | 4% |
| 6.0% | $100 | 2,237 | $223,748 | 5% |
| 7.0% | $100 | 2,255 | $225,456 | 6% |
| 8.0% | $101 | 2,272 | $229,436 | 7% |
| 9.0% | $102 | 2,289 | $233,449 | 9% |
| 10.0% | $100 | 2,306 | $230,580 | 8% |
| 0.8 | 2135 | |||
| Total Forecasted Sales | 2135 |