Table of Contents
Evaluation Consideration and Evaluation Measures. 2
Problem Statement
Transport costs tend to significantly affect the structural organization of the company. According to a study by (Rodrigue & Notteboom, 2020) on the geography of transport, “…raising transport costs by 10% reduces trade volumes by more than 20% and that the general quality of transport infrastructure can account for half of the variation in transport costs.” Transportation rates include the costs bared by the users/retailers in this case. Reducing the shipping costs incurred by the retailers, can at least hypothetically influence the number of goods ordered by the retailers. If the company has to bear the costs of transportation, the company will have to adjust other factors such that the costs incurred by the company do not lead to losses. Accounting for the variations in demand across different seasons is an important feature of business operations. However, the problem arises when the forecasted demand falls short of the actual market demand necessitating the calling in of supplies from other plants. In these cases, the costs incurred from transporting the supplies to the home distribution center from another center may increase the company’s expenditure leading to lower revenue or in extreme cases, lead to losses.
Distance as a factor is considered as the standard proxy of the transportation costs since following the assumption that the cost of transportation increases monotonically with the increase of space (Tanaka, 2010). Currently, the company produces products from 5 different locations. Even though the company can close 4 other plants and concentrate on producing the products from a single store, factors such as transportation costs, and time taken for freights provide a hindrance towards the closure of other plants.
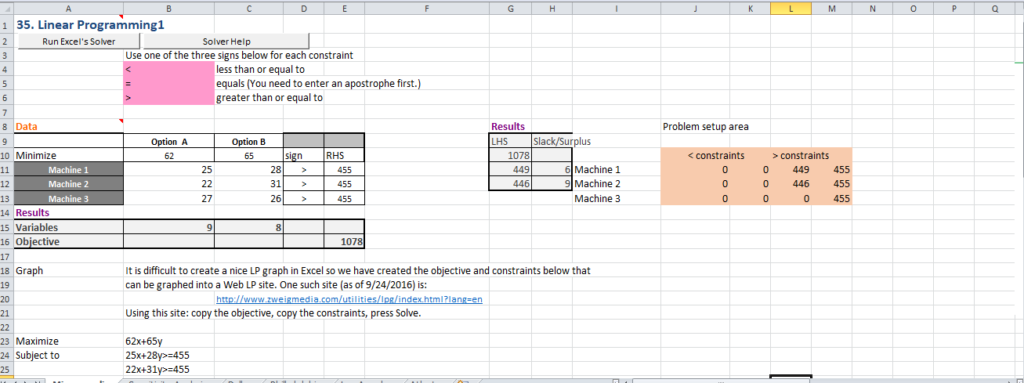
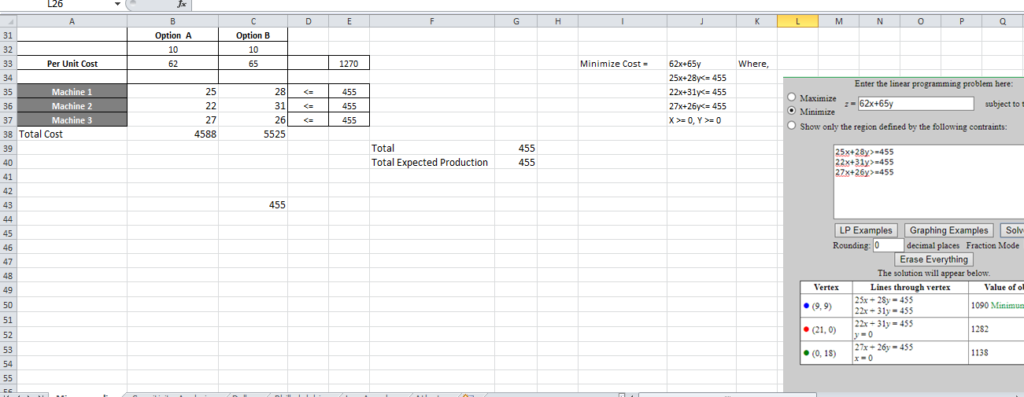
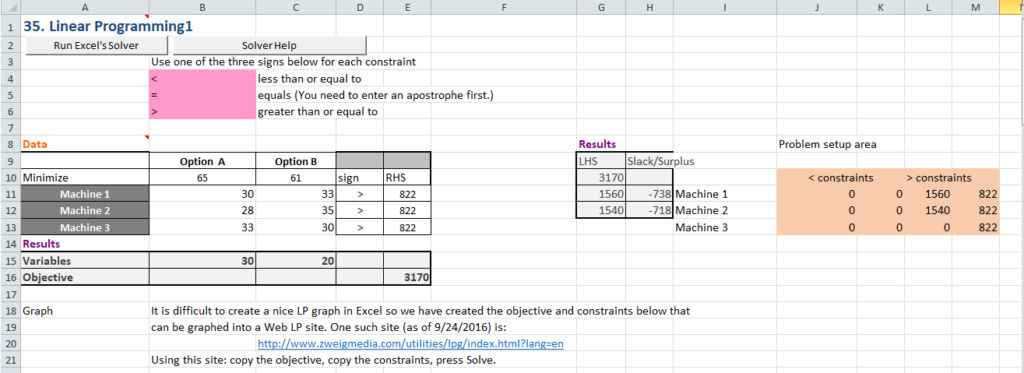
Making all other factors constant, what would be the optimal location from which the company would manufacture the product but still reduce the transportation cost and time incurred as opposed to closing all the plants and manufacturing from a single point?
The preceding question informs the business problem that will be examined in the following report.
Evaluation Consideration and Evaluation Measures
Evaluation consideration
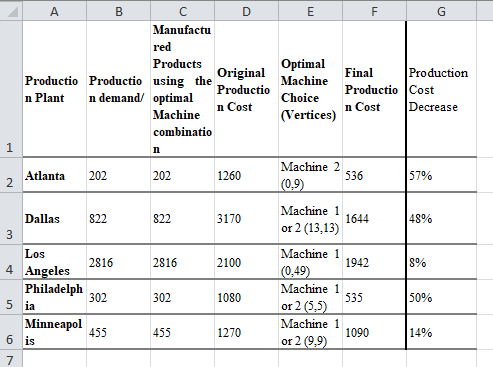
Given a zero-point i.e. non-existent central manufacturing center, what measure would be used to determine the optimal location to develop the new central manufacturing plant? Currently, we know that the company has five plants serving different regions in Philadelphia, others in Atlanta, Dallas, Los Angeles, and Minneapolis. Using the new location, which location has the least load size based on the total sales recorded over the past 9 months?
Evaluation Metrics
For analysing the available information company has used factor rating and centre of gravity method to help identify the best new location for the manufacturing plant while taking into consideration the locations of the distribution centers.
Decision Alternatives
Our objective is to propose an optimal location apart from the current plants. Therefore, the decision alternatives for this problem include:
- Adopt the new location and close all other plants
- Adopt the new location and close plants that have relatively lower loads
- Do not close any plant since the loads are still high relative to the new location
Scenario and Data
Using the total sales for each of the plants in the latest 9 months as the loads for each distribution center, table 1 below provides an overview of the center of gravity information.
Table 1: Shipping information
| Costs to Ship from Plant to Distribution Center (costs per Unit) | ||||||
| Philadelphia, PA Distribution Center | Altanta, GA Distribution Center | Dallas, TX Distribution Center | Minneapolis, MN Distribution Center | Los Angeles, CA Distribution Center | Total cost | |
| Rochester, NY Plant | $1.29 | $1.51 | $1.54 | $1.53 | $1.69 | 7.56 |
| Altanta, GA Plant | $1.41 | $1.24 | $1.40 | $1.47 | $1.54 | 7.06 |
| Houston, TX Plant | $1.54 | $1.40 | $1.12 | $1.52 | $1.69 | 7.27 |
| Minneapolis, MN Plant | $1.49 | $1.47 | $1.45 | $1.17 | $1.59 | 7.17 |
| San Diego, CA Plant | $1.66 | $1.61 | $1.51 | $1.59 | $1.01 | 7.38 |
Analysis Results
Table 2 below shows the Distance from the manufacturing plant Philadelphia (We used each plant’s location by shiping cost relative to that pant to comute the total costs. Table 2 below shows the results of the COG analysis.
Table 2: COG results
| Philadelphia, PA Distribution Center | Altanta, GA Distribution Center | Dallas, TX Distribution Center | Minneapolis, MN Distribution Center | Los Angeles, CA Distribution Center | Total | |
| Rochester, NY Plant | 10526.4 | 7140.79 | 23660.56 | 13356.9 | 79076.79 | 133761.4 |
| Altanta, GA Plant | 11505.6 | 5863.96 | 21509.6 | 12833.1 | 72058.14 | 123770.4 |
| Houston, TX Plant | 12566.4 | 6620.6 | 17207.68 | 13269.6 | 79076.79 | 128741.1 |
| Minneapolis, MN Plant | 12158.4 | 6951.63 | 22277.8 | 10214.1 | 74397.69 | 125999.6 |
| San Diego, CA Plant | 13545.6 | 7613.69 | 23199.64 | 13880.7 | 47258.91 | 105498.5 |
| Average Total value | 123554.2 |
From table 2 above we note that the average of total value is 123554.214 which is near by Atlanta GA plant. Therefore, the plant in Atlanta is considered centre of gravity and company must try to increase its capacity so that it can earn more revenue as well. This observation is in line with the rating computed earlier
Conclusion
Originally, the decision alternatives for this problem were given as:
- Adopt the new location and close all other plants
- Adopt the new location and close plants that have relatively lower loads
- Do not close any plant since the loads are still high relative to the new location
Based on our analysis, increasing the production capacity of the plant in Atlanta would increase help the company cut costs hence increase revenue. However, we had earlier noted that the company is cautious about closing the other plants and using a single plant. Based on this precautionary measure, the company might consider keeping the other plants but reduce the production capacity and the goods distributed to the respective centers while increasing the volume at Atlanta.
References
Rodrigue, J.-P., & Notteboom, T. (2020). The Geography of Transport Systems (5th ed.). New York: Routledge. From Transport Geography.
Tanaka, K. (2010). Transport costs, distance, and time: evidence from the Japanese Census of Logistics. Wakaba, Mihama Ward, Chiba: Institute of Developing Economies – Japan External Trade Organization (JETRO).