Weak wage growth implies that the revenue from tax has been less in terms of expectation, higher payments to the government that includes family tax benefits, and less consumer spending. Further, lower economic growth is seen owing to the weak wage growth. The weakness in the wages is one of the vital results of the poor performance of the living standards, as well as dissatisfaction among the public. The weak wage growth can even be linked to the automatic enrolment of employees into scheme of pension with mandate contribution of the employer (Mankiw et. al, 2011). In this scenario, the cost of employment is rising at a rapid pace other than the salaries. This clearly indicates the weak wage growth puts enormous pressure on the short-term economic growth. This results into weak productivity and thereby the economic productivity fails to increase.
Figure 1 Weak Wage growth through AD & AS model
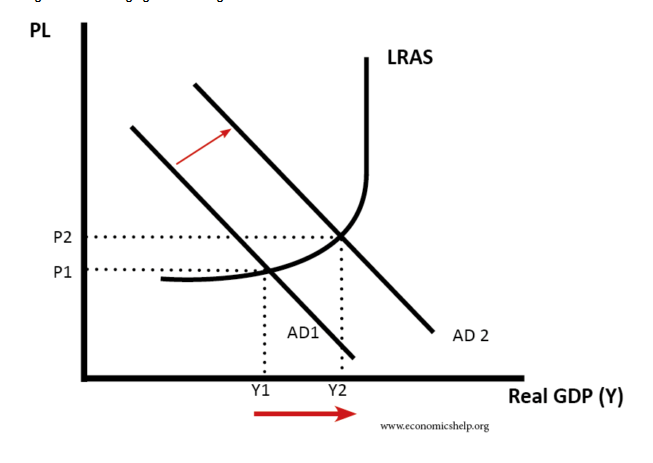
(Source: economicshelp.org)
Answer – 2
The AS/AD model is one of the most important tools of economics because it is said to provide a very basic framework for all the economic factors that present together diagram. The diagrams and models doesn’t generally determine the speed of the economic growth rather the aggregate demand and supply model helps to create an observation of the long term economic growth faced of the organizations.
It has been generally observed that the cyclical unemployment is related to the rise in importance of the framework of aggregate demand and supply because the equilibrium is below the initial level of GDP and also a decrease in the level of GDP is observed when the equilibrium is near the initial point (Yamarone, 2012). It is generally observed that the natural rate of unemployment can be determined with the help of the labor market institutions present in the economy that are built with the help of initial GDP rate. Also, they are not presented in the diagrams. There are various abbreviations present for ascertaining the precious for inflation are going to rise or fall also movements from a particular equilibrium to another state that change in the price level (Egert, 2015). The model of aggregate demand and supply will not only help us to make assumptions based on the economic structure but will also help us to analyze other economic factors as well.
Macroeconomic is also very important in order to analyze the economic condition. It is basically using three concepts consisting of growth, inflation rate and the low unemployment rate in order to judge the economy. The elements of aggregate demand and aggregate supply can be divided on the basis of economic events and policy decision making can also be assessed (Braeutigam, 2010). The basic demand and supply model is one of the most important instruments in economics because it helps us to bring all factors together in one diagram and then assess the functionality and growth of the organization (Braeutigam, 2010). The framework is observed to be very flexible because of the capability to focus on short term aggregate demand changes and also at the same time long term changes in the aggregate supply.
Generally, it is observed that both long and short term changes are observed in GDP which can be analyzed easily with the help of the AS/AD model. The vertical line which is said to represent the initial GDP rate will not only help to improve the employment level of the organizations but also will help to increase the GDP with the gradual increase in time. The shifts in the vertical lines can also be noticed in the diagram mentioned below which states the pattern of economic growth over 3 years.
There are many other factors that can help us to find the speed of the long term economic growth rate after analyzing the investments made in human and physical capital, technology or any other type of economic advantage that are not directly appearing in the diagram.
Figure 2 AD-AS model
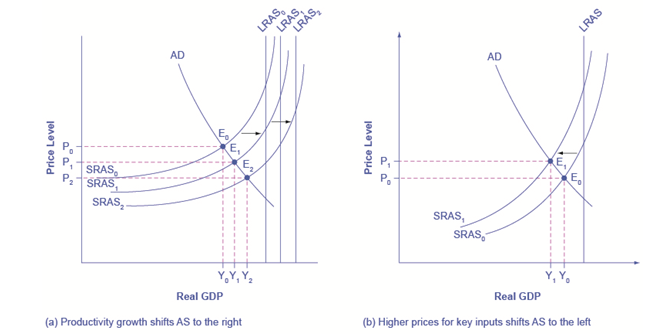
(Benmelech et. al, 2018)
It is observed in the short run that GDP varies in every economy because of the different periods that are faced by a country. However, in the aggregate demand and supply diagram, it is clearly stated that the equilibrium level of the real GDP is considerably below the actual GDP.
Figure 3 Equilibrium level of the real GDP
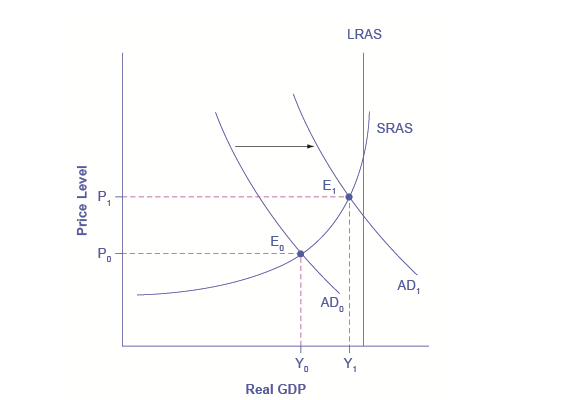
(Kari, 2017)
Answer – 3(a)
Part time employment has increased considerably across the globe and Australia is no big exception. Australia ranks third when it comes to the highest proportion of workers who are employed on a part-time basis (Blanchard & Leigh, 2013).
The structure of the Australian labor market has increased with the due passage of time and there have been major changes in the labor supply and demand of Australian labor market. The major significant change is noted in the part-time employment. The unemployment rate stood at a high of 11.22% in 1992 while it dropped to 5% in the year 2018. An observation in the increase in part-time employment has been made which is considerable because it consists of more than one-third part of the employment. The supply function of the organization not only uses the physical labor of employees but also it needs to combine with other paid activities like education, caring of family members and leisure(Blanchard & Leigh, 2013). Hence, in the current scenario, it is essential the firms are prone to have a strong labor force and when the demand surge they need to hire employees on a part time basis. Such a change in the scenario has changed the entire perspective. Hence, increment in the part time work force has been entirely due to the demand fluctuations wherein both the companies, as well as the workforce can benefit.
What is the natural rate of unemployment?
The term natural unemployment can be described as the lowest rate that can be obtained in terms of unemployment by an economy. It is also mentioned to be normal because of the variations caused by the effects of a bad economy. Frictional employment is also a part of natural unemployment and this type of unemployment is said to be caused because of the changes in jobs and the shift of people from one City to another in search of other options that and provide them with better amenities. It is a common knowledge that irrespective of stability in the economy, there will be unemployed people always, who are in search of jobs. Another important part of natural unemployment is the structural unemployment which consists of the workers who fails to find the job of the organization all the organizations fail to find the employee who is in need of a job. This problem is generally observed in the economy during the long term. The most common economic changes that are observed to create structural unemployment are the rapid reallocation of available jobs and technological advances that have been made in various fields. Surplus and employment is also a part of natural employment and is constituted of the weight control measures that are put in by union or minimum wages law. This is also said to force the organizations to minimize their workforce so that they can stay within the budget. This type of unemployment is observed in every situation no matter how good the economy of a country is. Also, there is no solution to this economic constraint. Hence, it has been stated by the most economists that if the economy reaches a natural level of unemployment rate then the economy said to have full employment. Generally, it has been accepted by the economist that the normal rate of unemployment should be around 4%.
Long run aggregate supply curve
Generally, in
the long run, only capital, labor, and technology measures are affected because
of the aggregate supply curve. When this point is reached, it can be stated
that everything is being used optimally in the economy. Generally, the long run
aggregate supply curve is static in nature because of the slow shift of the
three ranges of the aggregate supply curve (Benmelech et. al, 2018). This curve
is perfectly vertical and reflects the belief of economist about changing
aggregate demand on the basis of the total output of the economy. Also, in the
long run, there is one quantity that will be supplied.
Answer 3(b)
The NAIRU cannot be ascertained in a direct manner but it is real. Whether it is 5 percent or 4 percent ascertains how many people and how much money is being paid. It can be commented as one of the important numbers for knowing the economy. Incorrect assumption regarding will lead to issue because in this scenario it will be assumed that the workers are scarce and companies need to start increasing pay so that new workers are recruited (Autor et. al, 2017). Moreover, when workers are scarce, companies need to further enhance the price that lead to further demand for increment in wages.
Figure 4 AD-AS model of NAIRU
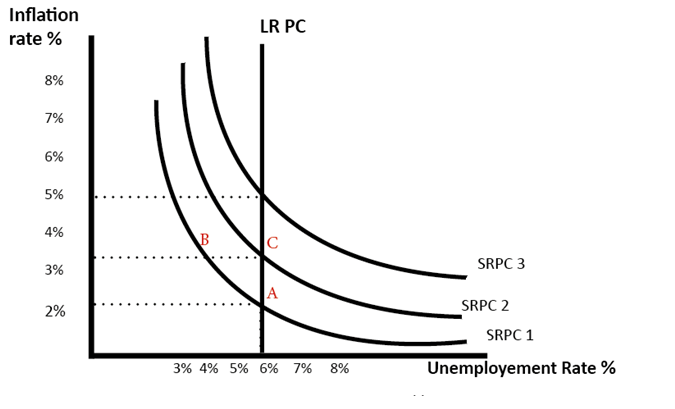
(Kari, 2017)
The above
scenario provides an apt example that the natural rate of unemployment is 6
percent. If the unemployment rate is reduced by way of increased demand then a
temporary drop in the unemployment will be witnessed but with a higher level of
inflation. On the contrary, the fall in the unemployment is unsustainable and
the short run Philip curve will move to SRPC2 and it reaches to a new point C.
References
Autor, D., Dorn, D, Katz, L. F, Patterson, C. and Reenen, J. V. (2017) The Fall of the Labor Share and the Rise of Superstar Firms. National Bureau of Economic Research Working Paper No. 23396. Available from: https://economics.mit.edu/files/12979 [Accessed 18 April 2019]
Benmelech, E., N. Bergman and H. Kim. (2018) Strong Employers and Weak Employees: How Does Employer Concentration Affect Wages? National Bureau of Economic Research Working Paper No. 24307. Available from: https://www.kellogg.northwestern.edu/faculty/benmelech/html/BenmelechPapers/BBK_2018_January_31.pdf [Accessed 18 April 2019]
Blanchard, O.J. & Leigh, D. (2013) Growth forecast errors and fiscal multipliers. The American Economic Review, vol. 103, no. 3, pp.117-120. Available from: https://EconPapers.repec.org/RePEc:eee:jmacro:v:43:y:2015:i:c:p:226-238 [Accessed 18 April 2019]
Braeutigam, R. (2010) Microeconomics (4th ed.). Wiley.
Egert, B. (2015) Public debt, economic growth and nonlinear effects: myth or reality? Journal of Macroeconomics, vol. 43, pp. 226-238. Available from: http://www.sciencedirect.com/science/article/pii/S0164070414001335 [Accessed 18 April 2019]
Kari, D. (2017) Short-Run Trade-Off between Inflation and Unemployment. Available from: http://www.economicsdiscussion.net/aggregate-supply/short-run-trade-off-between-inflation-and-unemployment-with-diagram/15900 [Accessed 18 April 2019]
Mankiw N. Gregory, N and Scarth, William M. (2011) Macroeconomics. Canadian ed., 4th ed. New York: Worth Publishers
Mankiw, N.G and Taylor, M.P. (2011) Economics (2nd ed). Andover: Cengage Learning
Wagner, A. (2013) Dynamic Circular Flow Models with Innovations. In The Two Sides of Innovation. Springer International Publishing.
Yamarone, R. (2012) Gross Domestic Product. The Trader’s Guide to Key Economic Indicators. Penguin Press