Assignment Samples & Case Study Review Sample: The biggest assignment sample database – Chat with MyAssignmentHelp.com Experts to get your own custom made paper!
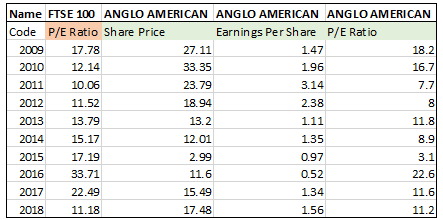
The above figure directly states about the overall P/E ratio of Anglo-American Company for the past 10 years. The above calculations states about the overall P/E ratio, which changes with the earnings per share of the organisation (Sharif, Purohit & Pillai, 2015). There is direct link between the P/E ratio of the company and the FTSE 100, where decline int eh value in the market is witnessed within the organisation. From the relevant analysis, it has been detected that the increment in P/E ratio of the industry and the company is similar in nature, which directly affects the overall share price conditions of the company. Thus, in the similar process the overall share price value of the companies has reacted with the price fluctuations of the Index. The impact of P/E ratio of the organisations are similar, which is mainly altering the share price of the company on yearly basis regardless of the EPS increment. The company’s EPS has lower impact on their share price, where higher income generated by the organisation has minimal impact on its valuation (Arkan, 2016).
There are other factors that have an impact on the share price value of the company, which are depicted as follows.
Change in the current capital market trend, which have direct impact on the share valuation of the company.
Changes in the dividend declared by the organisation, which crates demand in the capital market (Phan, Sharma & Narayan, 2015).
Alterations in debt to equity conditions and beta values directly have impact on valuation of the company.
Question 3: Portfolio Analysis
a) Creating four equally weighted portfolios:
Particulars
Standard deviation
Variances
4IMPRINT GROUP
0.100729234
0.0101464
888 HOLDINGS
0.118957046
0.0141508
ANTOFAGASTA
0.106566601
0.0113564
APTITUDE SOFTWARE GROUP
0.093084265
0.0086647
ASHTEAD GROUP
0.118861442
0.014128
AVEVA GROUP
0.08908344
0.0079359
AVON RUBBER
0.112430088
0.0126405
BARRATT DEVELOPMENTS
0.112670306
0.0126946
BBA AVIATION
0.074077065
0.0054874
BELLWAY
0.084837151
0.0071973
BERKELEY GROUP HDG.
0.069108868
0.004776
BIG YELLOW GROUP
0.074986049
0.0056229
BODYCOTE
0.091657435
0.0084011
BOOT (HENRY)
0.069768271
0.0048676
BURBERRY GROUP
0.086923304
0.0075557
Portfolio 1
0.100729234
0.0101464
Portfolio 2
0.064069262
0.0041049
Portfolio 3
0.055468302
0.0030767
Portfolio 4
0.050800969
0.0025807
Particulars
Standard deviation
Variances
Return
Portfolio 1
0.100729234
0.0101464
0.02592
Portfolio 2
0.064069262
0.0041049
0.02138
Portfolio 3
0.055468302
0.0030767
0.02201
Portfolio 4
0.050800969
0.0025807
0.02012
Particulars
Standard deviation
Variances
Portfolio 1
0.100729234
0.010146379
4IMPRINT GROUP
0.100729234
0.010146379
Particulars
Standard deviation
Variances
Portfolio 2
0.100729234
0.010146379
4IMPRINT GROUP
0.100729234
0.010146379
888 HOLDINGS
0.118957046
0.014150779
ANTOFAGASTA
0.106566601
0.011356441
APTITUDE SOFTWARE GROUP
0.093084265
0.00866468
ASHTEAD GROUP
0.118861442
0.014128042
Particulars
Standard deviation
Variances
Portfolio 3
0.100729234
0.010146379
4IMPRINT GROUP
0.118957046
0.014150779
888 HOLDINGS
0.106566601
0.011356441
ANTOFAGASTA
0.093084265
0.00866468
APTITUDE SOFTWARE GROUP
0.118861442
0.014128042
ASHTEAD GROUP
0.08908344
0.007935859
AVEVA GROUP
0.112430088
0.012640525
AVON RUBBER
0.112670306
0.012694598
BARRATT DEVELOPMENTS
0.074077065
0.005487412
BBA AVIATION
0.084837151
0.007197342
BELLWAY
0.069108868
0.004776036
Particulars
Standard deviation
Variances
Portfolio 4
0.050800969
0.002581
4IMPRINT GROUP
0.100729234
0.010146
888 HOLDINGS
0.118957046
0.014151
ANTOFAGASTA
0.106566601
0.011356
APTITUDE SOFTWARE GROUP
0.093084265
0.008665
ASHTEAD GROUP
0.118861442
0.014128
AVEVA GROUP
0.08908344
0.007936
AVON RUBBER
0.112430088
0.012641
BARRATT DEVELOPMENTS
0.112670306
0.012695
BBA AVIATION
0.074077065
0.005487
BELLWAY
0.084837151
0.007197
BERKELEY GROUP HDG.
0.069108868
0.004776
BIG YELLOW GROUP
0.074986049
0.005623
BODYCOTE
0.091657435
0.008401
BOOT (HENRY)
0.069768271
0.004868
BURBERRY GROUP
0.086923304
0.007556
Co-variance
4IMPRINT GROUP
888 HOLDINGS
ANTOFAGASTA
APTITUDE SOFTWARE GROUP
ASHTEAD GROUP
4IMPRINT GROUP
0.010146379
0.000755711
0.000632169
0.001149847
0.00386227
888 HOLDINGS
0.000755711
0.014150779
0.002581876
0.001016121
0.003762998
ANTOFAGASTA
0.000632169
0.002581876
0.011356441
0.001553492
0.004597827
APTITUDE SOFTWARE GROUP
0.001149847
0.001016121
0.001553492
0.00866468
0.002175409
ASHTEAD GROUP
0.00386227
0.003762998
0.004597827
0.002175409
0.014128042
b) Determining the betas for BP and Ferguson
BP
SUMMARY OUTPUT
Regression Statistics
Multiple R
0.683602933
R Square
0.46731297
Adjusted R Square
0.462798673
Standard Error
0.054633646
Observations
120
ANOVA
df
SS
MS
F
Significance F
Regression
1
0.308985495
0.308985495
103.5184401
7.72853E-18
Residual
118
0.352210566
0.002984835
Total
119
0.661196061
Coefficients
Standard Error
t Stat
P-value
Lower 95%
Upper 95%
Lower 95.0%
Upper 95.0%
Intercept
-0.004620976
0.005034128
-0.917929845
0.360528015
-0.01458992
0.005347968
-0.01458992
0.005347968
FTSE ALL SHARE (Beta)
1.427864732
0.140338945
10.17440122
7.72853E-18
1.149955414
1.70577405
1.149955414
1.70577405
FERGUSON
SUMMARY OUTPUT
Regression Statistics
Multiple R
0.526440179
R Square
0.277139262
Adjusted R Square
0.271013323
Standard Error
0.079622367
Observations
120
ANOVA
df
SS
MS
F
Significance F
Regression
1
0.286810862
0.286810862
45.24029479
6.5913E-10
Residual
118
0.748087118
0.006339721
Total
119
1.03489798
Coefficients
Standard Error
t Stat
P-value
Lower 95%
Upper 95%
Lower 95.0%
Upper 95.0%
Intercept
0.007451493
0.007336673
1.01565024
0.311873944
-0.007077116
0.021980103
-0.007077116
0.021980103
FTSE ALL SHARE (Beta)
1.375674915
0.204528157
6.726090602
6.5913E-10
0.970653481
1.780696349
0.970653481
1.780696349
References:
Arkan, T. (2016). The importance of financial ratios in predicting stock price trends: A case study in emerging markets. Finanse, Rynki Finansowe, Ubezpieczenia, 79(1), 13-26.
Phan, D. H. B., Sharma, S. S., & Narayan, P. K. (2015). Stock return forecasting: some new evidence. International Review of Financial Analysis, 40, 38-51.
Sharif, T., Purohit, H., & Pillai, R. (2015). Analysis of factors affecting share prices: The case of Bahrain stock exchange. International Journal of Economics and Finance, 7(3), 207-216.