INTRODUCTION
This report represents the aim of a campaign manager, who wish to determine the relationship between the proposed television advertisement and its impact for voting a candidate in the election. The data scientist has decided to utilize an experimental design for testing the proposed campaign advertisement’s effectiveness. As a data scientist, this report will present an experimental design which will help to give money related advice to the campaign manager with respect to expense of proposed television advertisement.
ANSWER
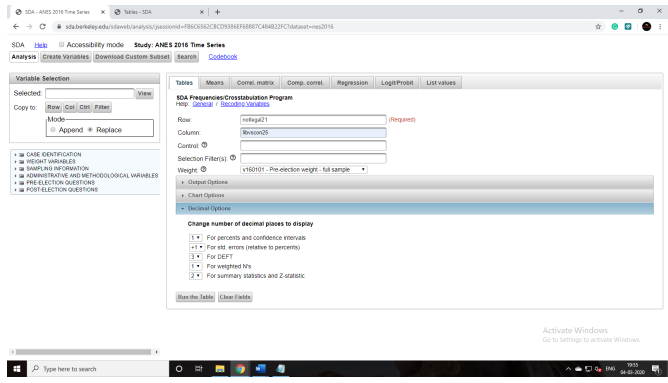
Here, a cross tab table created from the ANES dataset to select the dependent and independent variable as demonstrated below.
ANSWER
| SDA 4.1: MeansANES 2016 Time Series |
| Mar 04, 2020 (Wed 06:34 AM PST) |
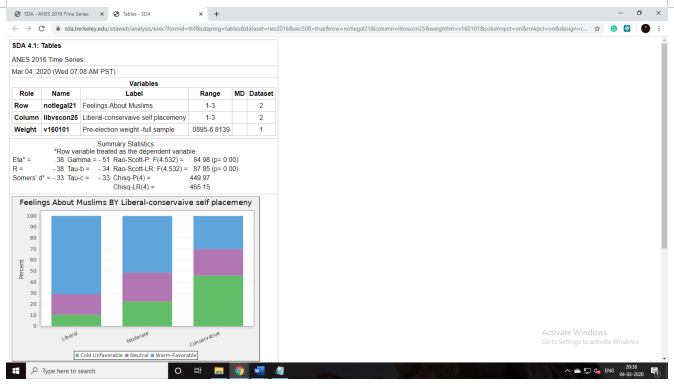
| VariablesRoleNameLabelRangeMDDatasetDependentnotlegal21Feelings About Muslims1-3 2Rowlibvscon25Liberal-conservaive self placemeny1-3 2Columnnotlegal21Feelings About Muslims1-3 2Weightv160101Pre-election weight -full sample.0895-6.8139 1 |
| Main StatisticsCells contain: –Mean -Complex Std Errs -Std Devs -Minimum -Maximum -Weighted Nnotlegal211 Cold-Unfavorable2 Neutral3 Warm-FavorableROW TOTALlibvscon251: Liberal1.00 .000 .000 1.00 1.00 95.92.00 .000 .000 2.00 2.00 175.83.00 .000 .000 3.00 3.00 670.22.61 .025 .665 1.00 3.00 941.82: Moderate1.00 .000 .000 1.00 1.00 191.62.00 .000 .000 2.00 2.00 222.83.00 .000 .000 3.00 3.00 441.22.29 .032 .809 1.00 3.00 855.73: Conservative1.00 .000 .000 1.00 1.00 527.32.00 .000 .000 2.00 2.00 276.83.00 .000 .000 3.00 3.00 344.91.84 .028 .857 1.00 3.00 1,149.0COL TOTAL1.00 .000 .000 1.00 1.00 814.72.00 .000 .000 2.00 2.00 675.43.00 .000 .000 3.00 3.00 1,456.42.22 .020 .851 1.00 3.00 2,946.5 |
| Color coding:<-1.0<-0.5<0.0>0.0>0.5>1.0ZMean in each cell:Smaller than averageLarger than average |
| Analysis of Variance SSQEta_sqMain effects2,131.3431.000libvscon25.000.000notlegal211,819.041.853Interaction.000.000Residual.000.000Total2,131.3431.000 |
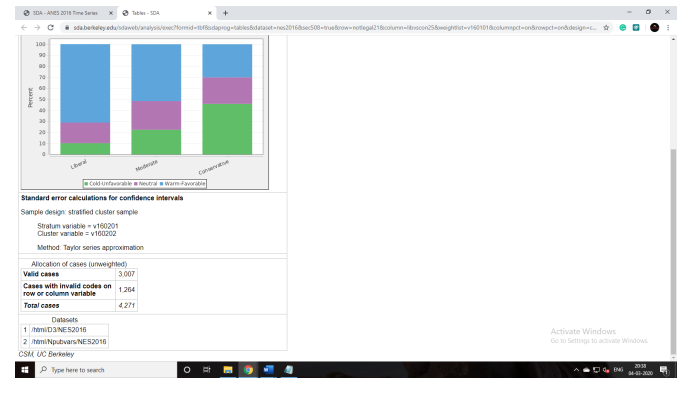
| Standard error calculationsSample design: stratified cluster sampleStratum variable = v160201Cluster variable = v160202Method: Taylor series approximation |
| Allocation of cases (unweighted)Valid cases3,007Cases with invalid codes on row or column variable1,264Total cases4,271 |
| Datasets1/html/D3/NES20162/html/Npubvars/NES2016 |
CSM, UC Berkeley
ANSWER
The first category response is cold unfavorable for the dependent variables (“SDA – ANES 2016 Time Series”),
| Cells contain: –Mean -Complex Std Errs -Std Devs -Minimum -Maximum -Weighted N | notlegal21 | ||||
| 1 Cold-Unfavorable | 2 Neutral | 3 Warm-Favorable | ROW TOTAL | ||
| libvscon25 | 1: Liberal | 1.00 .000 .000 1.00 1.00 95.9 | 2.00 .000 .000 2.00 2.00 175.8 | 3.00 .000 .000 3.00 3.00 670.2 | 2.61 .025 .665 1.00 3.00 941.8 |
| 2: Moderate | 1.00 .000 .000 1.00 1.00 191.6 | 2.00 .000 .000 2.00 2.00 222.8 | 3.00 .000 .000 3.00 3.00 441.2 | 2.29 .032 .809 1.00 3.00 855.7 | |
| 3: Conservative | 1.00 .000 .000 1.00 1.00 527.3 | 2.00 .000 .000 2.00 2.00 276.8 | 3.00 .000 .000 3.00 3.00 344.9 | 1.84 .028 .857 1.00 3.00 1,149.0 | |
| COL TOTAL | 1.00 .000 .000 1.00 1.00 814.7 | 2.00 .000 .000 2.00 2.00 675.4 | 3.00 .000 .000 3.00 3.00 1,456.4 | 2.22 .020 .851 1.00 3.00 2,946.5 |
ANSWER
This question is used to compute lambda as demonstrated below.
| Datasets |
| Allocation of cases (unweighted) |
| Summary Statistics *Row variable treated as the dependent variable. |
| Variables |
| SDA 4.1: TablesANES 2016 Time Series |
| Mar 04, 2020 (Wed 07:03 AM PST) |
| RoleNameLabelRangeMDDatasetRowgender 1-2 2Columnvotevote1-2 2Weightv160101Pre-election weight -full sample.0895-6.8139 1 |
| Eta* =.00 Gamma =.01 Rao-Scott-P: F(1,133) =.04(p= 0.84)R =.00 Tau-b =.00 Rao-Scott-LR: F(1,133) =.04(p= 0.84)Somers’ d* =.00 Tau-c =.00 Chisq-P(1) =.06 Chisq-LR(1) =.06 |
| Standard error calculations for confidence intervalsSample design: stratified cluster sampleStratum variable = v160201Cluster variable = v160202Method: Taylor series approximation |
| Valid cases3,607Cases with invalid codes on row or column variable664Total cases4,271 |
| 1/html/D3/NES20162/html/Npubvars/NES2016 |
CSM, UC Berkeley
Based on Results,
- level of measurement for lambda is 1-2.
- Proportionate reduction in error is 0.00
- Value of Lambda relating independent and dependent variables like vote and gender is, 0.84.
ANSWER
This question is used to compute gamma and sommers’s dyx which is demonstrated below.
| Datasets |
| Allocation of cases (unweighted) |
| Summary Statistics *Row variable treated as the dependent variable. |
| Variables |
| SDA 4.1: TablesANES 2016 Time Series |
| Mar 04, 2020 (Wed 06:59 AM PST) |
| RoleNameLabelRangeMDDatasetRowgender 1-2 2Columntrust 1-3 2Weightv160101Pre-election weight -full sample.0895-6.8139 1 |
| Eta* =.01 Gamma =-.02 Rao-Scott-P: F(2,266) =.10(p= 0.90)R =-.01 Tau-b =-.01 Rao-Scott-LR: F(2,266) =.10(p= 0.90)Somers’ d* =-.01 Tau-c =-.01 Chisq-P(2) =.30 Chisq-LR(2) =.30 |
| Standard error calculations for confidence intervalsSample design: stratified cluster sampleStratum variable = v160201Cluster variable = v160202Method: Taylor series approximation |
| Valid cases4,200Cases with invalid codes on row or column variable71Total cases4,271 |
| 1/html/D3/NES20162/html/Npubvars/NES2016 |
CSM, UC Berkeley
Based on results,
- Level of Measurement for Gamma and Sommer’s dyx is 0.0895 – 6.8139
- There is no Difference between the two statistics because both statistics has same P value is 0.90.
- Three Pairs are concordant, discordant tied on x, tied on y, and tied on x and y.
- Various Pairs are provide the meaningful coefficient because R value is -0.01 and Rao-Scott-P: F(2,266) = 0.10.
- Values of Gamma is -0.02 and value of Sommer’s dyx is -.0.01
This question is used to compute gamma and sommers’s dyx as demonstrated below.
ANSWER
| Datasets |
| Allocation of cases (unweighted) |
| Summary Statistics *Row variable treated as the dependent variable. |
| Variables |
| SDA 4.1: TablesANES 2016 Time Series |
| Mar 04, 2020 (Wed 07:05 AM PST) |
| RoleNameLabelRangeMDDatasetRowgender 1-2 2Columnnotlegal21Feelings About Muslims1-3 2Weightv160101Pre-election weight -full sample.0895-6.8139 1 |
| Eta* =.07 Gamma =.12 Rao-Scott-P: F(2,266) =6.47(p= 0.00)R =.07 Tau-b =.07 Rao-Scott-LR: F(2,266) =6.47(p= 0.00)Somers’ d* =.06 Tau-c =.08 Chisq-P(2) =18.99 Chisq-LR(2) =19.01 |
| Standard error calculations for confidence intervalsSample design: stratified cluster sampleStratum variable = v160201Cluster variable = v160202Method: Taylor series approximation |
| Valid cases3,537Cases with invalid codes on row or column variable734Total cases4,271 |
| 1/html/D3/NES20162/html/Npubvars/NES2016 |
CSM, UC Berkeley
References
“SDA – ANES 2016 Time Series”. Sda.Berkeley.Edu, 2020, https://sda.berkeley.edu/sdaweb/analysis/;jsessionid=FB6C6562CBCD9386EF68887C484B22FC?dataset=nes2016.