[A] The web scrapped data for criteria 1, has been named as Uncleaned Data_Criteria_1.csv
[B] The web scrapped data for criteria 1, has been named as Uncleaned Data_Criteria_2.csv
[C] After cleaning criteria 1 data, the revised file has been named as Cleaned Data_Criteria_1.xlsx
[D] After cleaning criteria 2 data, the revised file has been named as Cleaned Data_Criteria_2.xlsx
[E] Once the data have been cleaned basis criteria 1 and 2, both have been combined and produced a new excel file with the name Combined Data_criteria_1&2.xlsx. Here, range weights and score has been given to all points to evaluate overall performance. First of all, all the parameters are given equivalent weights of 10. Now, considering individual parameter, range has been calculated. For example, if we consider ford escape 2017 safety range, then first total safety score has been calculated for all four vehicles. Here it was 33. Further, total weights for criteria 1 was 30. Hence, range for ford escape was (6/33)*30 = 5.4545 or 5.5. Now, the total score has been calculated using range*weights = 5.4545*10=54.545 or 54.55. Similarly the score for other car ha ve also performed.
[F] Using tableau, criteria 1 has been visualized and the same has been saved as criteria_1.pdf
[G] Using tableau, criteria 1 has been visualized and the same has been saved as criteria_2.pdf
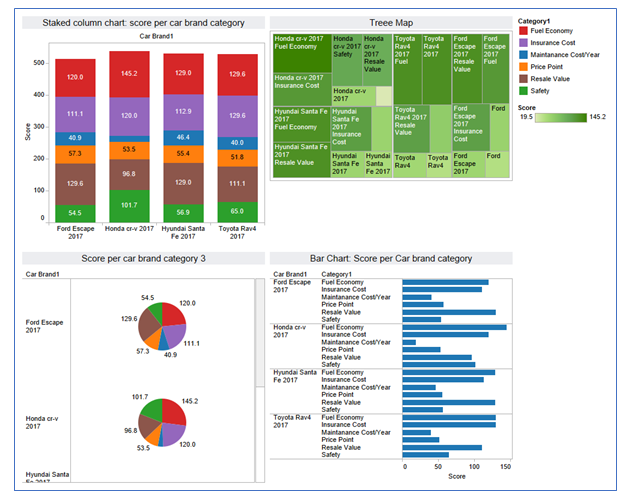
[H] A dashboard has been designed considering all parameters from criteria 1 and criteria 2 and the visualisation has been presented as Dashboard.pdf
[I] Prior to select the best feasible car, the company has mentioned few criteria’s basis which all these options will be evaluated. All these criteria are summed as criteria 1, which are safety rating, Maintenance cost and Price Point. However, the study further included a set of extra features under criteria 2, which are comfort and quality, feature rating, fuel economy, insurance cost, performance and style. The total accumulated score for ford is 513.47, whereas 536.61 is for Honda crv, 529.67 is for Hyundai santa and 527.10 is for Toyota Rav4. Considering the accumulated score, it can be said that Honda CRV is the best choice with score 536.61.
[J] The analyst has used effective elements of storytelling. In order to do so, the analyst has taken help from below things:
[a] tableau colour and symbol combinations;
[b] Different charts and symbol for visualisation;
[c] clean data set;
[d] https://www.thecarconnection.com
It has seen that costs of new cars will in general drop pointedly after the initial three years of proprietorship and, post that, values keep an eye on level. This is a decent sweet spot to locate a utilized car for purchasing. The dashboard as presented below consist of three features and all three features has shown that Honda CRV 2017 will be the most feasible one.
[K] The source that was used to scrap data was:
[L] Acknowledge source
Guided questions Answer Template (Please do not Remove the questions)
| Guided Question | Qualitative Study | Quantitative Study |
| Aim andSignificance (5 marks 200 words) | ||
| a. What was the aimand significance ofthe study? | ||
| Methods (10 marks 700 words) | ||
| a. Identify the research design used in the study and was it appropriate for the issue discussed? | ||
| b. Discuss the sampling technique, inclusion and exclusion criteria used for the selection of sample in the study | ||
| c.Explore the data collection method and its appropriateness to the research design of the study | ||
| Data analysis and results (10 marks 600 words) | ||
| a.How was the data analysed and was it appropriate for the study? | Data was analysed parallel with the interviews, After every interview the data was coded independently and the codes were compared and analysed for creating coding tree. The consensus meetings and the codings were performed recurrently for the first 15 interviews. The coding for the remaining 5 interviews was divided with one author reviewing and the other coding. Sorting and analysis of test fragments was done as per the identified themes. | . In this study, data was analysed through Statistic Package for Social Sciences version 20. Descriptive statistics was applied on the data collected from online survey to identify the logical responses and missing data. The strength of association between the three variables (medication errors, safe medication practice and workplace relationships) was investigated using frequency distribution and spearman’s correlation (SC). SC is a technique implemented to evaluate the direction and strength of a relationship between the two or three variable factors (Shuttleworth, 2018). In this study SC found that unsupportive workplace relationships are inversely associated with medication errors and erosion of safe medication practices. It was appropriate for the study for targeting a particular section of people, assessing their opinions and genuine views of genuine cross section of the nurses, and finding correlation between the three. |
| b.What were the findings/results of the study? | 20 Nurses were approached and three themes were analysed namely: Nurses role and responsibilities in medication safety, nurses’ ability to work in safe practices and their acceptance of safe practices. The factors affecting the nurses ability to work safely were identified as awareness of the risk of medication errors and the circumstances in which the nurse work. | The result of the study was: An increase in disruptive nurse and physician behaviour ruins the safety of medication among the graduate nurses. Study identified the importance of disruptive nurse behaviour in eroding the safe medication practices. |
| c.Discuss the limitations and recommendations of the study? | The findings of the qualitative study could be transferrable and may be relevant to other healthcare settings as well. The factors like work pressure and dependency of others might influence the practice environment of the settings which might impact the nurses role to perform the essential functions. Ethical approval was also not considered necessary for the study. The study recommends that the role of nurses should be supported by evidence based safety practices. The safety principles should be addressed by the nursing managers to develop a professional practice environment with consistent professional development. | The participants were recent graduates who were contacted through emails. It is possible that they did not access their email accounts. Another limitation was convenient sample, shortage of information on non responders and use of self report. The self reported data could be inaccurate and the sample of respondents’ population may not reflect the people under study. |
References
Shuttleworth,M.(2018). Survey Research Design. Retrieved from https://explorable.com/survey-research-design
Markov Chain (Final Project)
The Markov Chain with one-step transition matrix is given below.
P =
1. The above transition matrix is right stochastic if the sum of each row is 1 or it can be right stochastic if the sum of each column is 1 or it can be said that the matrix is doubly stochastic if both sum of row and column sums up to 1. Now, a MATLAB script is written to find the sum of each row and column.
MATLAB code:
P = [0.25 0.35 0.15 0 0.25;0.15 0.2 0.4 0.1 0.15;0.1 0.35 0.05 0.3 0.2;0.55 0 0.25 0.15 0.05;0 0.6 0.25 0 0.15];
for i=1:length(P)
scol(i) = sum(P(:,i));
srow(i) = sum(P(i,:));
end
srow
scol = scol’
Output:
sumprob
srow =
1 1 1 1 1
scol =
1.0500
1.5000
1.1000
0.5500
0.8000
Hence, as the row sum is 1 hence the state transition matrix is right stochastic only.
2. The nth step of Markov chain simulation is given by,
Where, is the probability vector after nth step.
= initial state distribution.
n = simulation number.
MATLAB code:
P = [0.25 0.35 0.15 0 0.25;0.15 0.2 0.4 0.1 0.15;0.1 0.35 0.05 0.3 0.2;0.55 0 0.25 0.15 0.05;0 0.6 0.25 0 0.15]; % state transition matrix
pi0 = [3/15 2/15 4/15 5/15 1/15]; % initial state distribution
n = 10000; % number of steps is 10000
fprob = pi0*(P^n); % final state probability matrix
row_sum = sum(fprob);
fprob
row_sum
Output:
EE380_Exp10_A
fprob =
0.1781 0.3050 0.2316 0.1176 0.1676
row_sum =
1.0000
Hence, it can be seen that after 10000 simulation the sum of probabilities in the row is equal to 1. Hence, the final state transition matrix is also right stochastic.
3. Now, the final probability array is generated after 10000 simulations for 20 randomly chosen initial distributions. The initial distributions are chosen from uniform distribution having values between [0,1].
MATLAB code:
P = [0.25 0.35 0.15 0 0.25;0.15 0.2 0.4 0.1 0.15;0.1 0.35 0.05 0.3 0.2;0.55 0 0.25 0.15 0.05;0 0.6 0.25 0 0.15]; % state transition matrix
for i=1:20
pi0 = rand(1,length(P)) % initial state distribution chosen randomly from uniform distribution
n = 10000; % number of steps is 10000
fprob = pi0*(P^n) % final state probability matrix
row_sum = sum(fprob)
end
Output:
EE380_Exp10_B
pi0 =
0.6557 0.0357 0.8491 0.9340 0.6787
fprob =
0.5617 0.9617 0.7303 0.3709 0.5286
row_sum =
3.1533
pi0 =
0.7577 0.7431 0.3922 0.6555 0.1712
fprob =
0.4845 0.8295 0.6299 0.3199 0.4559
row_sum =
2.7198
pi0 =
0.7060 0.0318 0.2769 0.0462 0.0971
fprob =
0.2063 0.3532 0.2682 0.1362 0.1941
row_sum =
1.1581
pi0 =
0.8235 0.6948 0.3171 0.9502 0.0344
fprob =
0.5024 0.8601 0.6532 0.3317 0.4727
row_sum =
2.8201
pi0 =
0.4387 0.3816 0.7655 0.7952 0.1869
fprob =
0.4574 0.7832 0.5948 0.3021 0.4305
row_sum =
2.5679
pi0 =
0.4898 0.4456 0.6463 0.7094 0.7547
fprob =
0.5426 0.9289 0.7054 0.3583 0.5106
row_sum =
3.0457
pi0 =
0.2760 0.6797 0.6551 0.1626 0.1190
fprob =
0.3371 0.5772 0.4383 0.2226 0.3172
row_sum =
1.8924
pi0 =
0.4984 0.9597 0.3404 0.5853 0.2238
fprob =
0.4645 0.7953 0.6039 0.3067 0.4371
row_sum =
2.6076
pi0 =
0.7513 0.2551 0.5060 0.6991 0.8909
fprob =
0.5526 0.9462 0.7185 0.3649 0.5200
row_sum =
3.1023
pi0 =
0.9593 0.5472 0.1386 0.1493 0.2575
fprob =
0.3655 0.6258 0.4753 0.2414 0.3440
row_sum =
2.0519
pi0 =
0.8407 0.2543 0.8143 0.2435 0.9293
fprob =
0.5490 0.9400 0.7138 0.3625 0.5167
row_sum =
3.0821
pi0 =
0.3500 0.1966 0.2511 0.6160 0.4733
fprob =
0.3361 0.5755 0.4371 0.2220 0.3163
row_sum =
1.8870
pi0 =
0.3517 0.8308 0.5853 0.5497 0.9172
fprob =
0.5762 0.9865 0.7492 0.3805 0.5422
row_sum =
3.2347
pi0 =
0.2858 0.7572 0.7537 0.3804 0.5678
fprob =
0.4890 0.8372 0.6358 0.3229 0.4602
row_sum =
2.7450
pi0 =
0.0759 0.0540 0.5308 0.7792 0.9340
fprob =
0.4229 0.7240 0.5498 0.2792 0.3979
row_sum =
2.3738
pi0 =
0.1299 0.5688 0.4694 0.0119 0.3371
fprob =
0.2703 0.4627 0.3514 0.1785 0.2543
row_sum =
1.5171
pi0 =
0.1622 0.7943 0.3112 0.5285 0.1656
fprob =
0.3495 0.5983 0.4544 0.2308 0.3289
row_sum =
1.9619
pi0 =
0.6020 0.2630 0.6541 0.6892 0.7482
fprob =
0.5267 0.9017 0.6847 0.3478 0.4956
row_sum =
2.9564
pi0 =
0.4505 0.0838 0.2290 0.9133 0.1524
fprob =
0.3258 0.5578 0.4236 0.2151 0.3066
row_sum =
1.8291
pi0 =
0.8258 0.5383 0.9961 0.0782 0.4427
fprob =
0.5132 0.8787 0.6673 0.3389 0.4830
row_sum =
2.8811
Hence, ti can be seen from the above simulations with 20 restarts that the sum of row probabilities are not equal to 1. Only, the sum is closest to 1 (1.1581) when the initial distribution is
Hence, if the sum of probabilities in the initial distribution is equal to 1 then the final probabilities after simulation of Markov chain will be equal to 1.
4.
Now, distribution is stationary as the sum of the probabilities of initial distribution is not equal to 1 and the equation for being stationary distribution is not satisfied. The equation for stationary distribution is
Social Media
Are people forgetting their real lives because of the virtual life offered by social media?
‘Social media’ is the term the millennial is most familiar with. It is the most dependable instrument for communication now-a-days. Not only in the field of communication, social media has left a deep impact in the fields of education, business, entertainment and so on. This argumentative essay looks at social media through an analytical prism. This essay throws a little focus on the benefits of social media, but major parts of this essay highlights the argument how social media is disconnecting people from their real lives. Hence, the purpose of this study is to throw lights on different roles played by social media in our lives. The thesis statement of this essay focuses on the argument that social media is disconnecting people from their real lives. This main argument is supported by two logical reasons. There is a counterargument which is again supported by two logical reasons. Finally, there is conclusion section which sums up the entire content and a provides a concluding statement.
It is true with the advancement of science; social media emerged as a virtual platform of communication and transcends all the geographical as well as the technical barriers to communication. The attractive features offered by social media is making the life of the mass faster, easier and full of fun. Social media has become the ‘virtual best friend’ to people who feel lonely. It does not only allow people to transcend their boundaries and mix with the world, but also makes them aware of the current affairs. According to experts, people now-a-days are more dependent on social media as compared to their own family members, which is interrupting their real-life communication.
Argument 1:
Social media is disconnecting people from their real lives:
Logical and clear reasons 1:
According to Hawi et al. (2017), the attractive pots on Facebook, twitter, Instagram LinkedIn, enhance the engagement of people with different social media platforms. People of every age, especially teenagers get engrossed in the attractive posts as well as all these amazing features provided by different social media platform. This deep engagement turns into social media addiction. Most of the people now-a-days spend maximum amount of time over social networking sites, YouTube channels. They keep on scrolling down to their profile, watching YouTube videos even when they are with their family. According to van den Eijnden et al. (2016), social media are flooded with news or posts which makes teen-ager, social media lovers excited every moment. Sometimes all of this exciting news are not true, but the illusionary effects created by social media collapse their power of reasoning and they start believing whatever social media offers them[1]. Thus, they become addicted to social media. They are unable to find out that kind of excitement in real life which they are able to find out in their virtual life as reality do not offer us fake excitements[2]. Hence, then start ignoring the reality. This is the reason they do not interact with their real friends and family. According to Andreassen et al. (2017), often teen agers are reluctant to understand their emotional attachment with their parents and real friends. In fact, Eijnden et al. (2016), argue that, the illusion created by social media is destroying emotional attachment of people with their family and friends and disconnecting people from their real lives
Logical and clear reasons 2:
According to psychologists, different social media platforms summon people, with exciting features, people can play games, gossip in live video chats, ask their friends’ for on live chats while shopping. The main reason behind this is to grab more and more viewers as well as account holders. In order to be successful to capture users, they flourish their websites with instigating and impulsive contents. This is casting a deep negative impact on human psychology. As a result, people are suffering from impulse control disorder, the effect of which is similar to the effects of using intoxicating drugs[3]. According to Andreassen et al. (2017), people of every age, especially teenagers are becoming excessively dependent on social media. This is harming them as drug addiction, as they start perceiving that the kind of peace or satisfaction, they receive from their engagement with social media cannot be received from anywhere[4]. According to Hawi et al. (2017), they become restless if there if they are unable to view their social media profiles for more than 5minutes. Social media addiction also give birth to self-obsession, selfishness. As a consequence of all these people are reluctant to interact face to face with their near and dear
ones. According to Eijnden et al. (2016), often social media addicted people find its difficult to conduct face to face interaction. This is the reason why they surround themselves with virtual friends instead of their real friends and families. Thus, social media is disconnecting people from their real lives.
Counterargument:
Social media is basically attaching people with their real lives more deeply
Elderly people of families are trying to learn skills to use social media from the young generation which is bringing them closer. Also, school friends can have a reunion over social media even if they are far from each other. People staying away from their families are able to see their family members over live chat on Facebook or video call using Google Duo. Long distance relationship and marriages are surviving over social media interaction. Hence experts consider social media a new platform to be close to our near and dear ones.
Logical and clear reasons 1:
Allcott, Hunt et al. (2019), argues that, social media is actually bringing people close to each other. In order to cope with the fast pace of digital life both the young and older generation are inclined to social media. Thus, social media is bringing the younger and older members of a family closer. Kim, consider that, in case of studies, students can easily contact with their professor or tutors over social media ask them for help or clear their doubts, even if, they are unable to attend lecture due to illness[5]. Students can keep contact with their favorite teacher or professor over social media even after their education was over. School or college friends can conduct reunion over social media, even if they are not in the same city or country. Hence, social media is attaching people with their real lives.
Logical and clear reasons 2:
Kim et al. (2016), argues that, social media is the most essential part of the lives of people who have to live far from their family because of their occupation of studies. Social media has brought them the opportunity to keep in touch with their families, enjoy beautiful moments with them through video chat. People are able to maintain long distance relationship due to social media. Not only friendship, even marriages are happening over social media Thus social media is a boon to the world which has connected us deeply with our near and dear ones[6]. People are able to protect their relationships with their family, spouse, transcending the limitation of distance, due to social media. Hence, social media is attaching people with their real lives.
Hence,
in the conclusion it can be said that, social media has both positive and
negative impacts on the real lives of human beings. People need to balance
their virtual and real life in a way so that the benefits of the social media
can be enjoyed the most.
References
Allcott, Hunt, et al. The Welfare Effects of Social Media. No. w25514. National Bureau of Economic Research, 2019.
Andreassen, Cecilie Schou, Ståle Pallesen, and Mark D. Griffiths. “The relationship between addictive use of social media, narcissism, and self-esteem: Findings from a large national survey.” Addictive behaviors 64 (2017): 287-293
Hawi, Nazir S., and Maya Samaha. “The relations among social media addiction, self-esteem, and life satisfaction in university students.” Social Science Computer Review 35.5 (2017): 576-586.
Kim, Yonghwan, Yuan Wang, and Jeyoung Oh. “Digital media use and social engagement: How social media and smartphone use influence social activities of college students.” Cyberpsychology, Behavior, and Social Networking 19.4 (2016): 264-269.
van den Eijnden, Regina JJM,
Jeroen S. Lemmens, and Patti M. Valkenburg. “The social media disorder
scale.” Computers in Human Behavior 61 (2016): 478-487.
[1] Hawi, Nazir S., and Maya Samaha. “The relations among social media addiction, self-esteem, and life satisfaction in university students.” Social Science Computer Review 35.5 (2017): 576-586.
[2] van den Eijnden, Regina JJM, Jeroen S. Lemmens, and Patti M. Valkenburg. “The social media disorder scale.” Computers in Human Behavior 61 (2016): 478-487.
[3] Andreassen, Cecilie Schou, Ståle Pallesen, and Mark D. Griffiths. “The relationship between addictive use of social media, narcissism, and self-esteem: Findings from a large national survey.” Addictive behaviors 64 (2017): 287-293
[4] van den Eijnden, Regina JJM, Jeroen S. Lemmens, and Patti M. Valkenburg. “The social media disorder scale.” Computers in Human Behavior 61 (2016): 478-487.
[5] Allcott, Hunt, et al. The Welfare Effects of Social Media. No. w25514. National Bureau of Economic Research, 2019.
[6] Kim, Yonghwan, Yuan Wang, and Jeyoung Oh. “Digital media use and social engagement: How social media and smartphone use influence social activities of college students.” Cyberpsychology, Behavior, and Social Networking 19.4 (2016): 264-269.