- Make a table of values for each of the following lines. Be sure to include negative values of x in each. Draw one set of axes plot both lines on the same graph. Be sure to fully label your graphs including axes, scale and the equations of the lines.
| x | y |
| -2 | -5 |
| -1 | -3 |
| 0 | -1 |
| 1 | 1 |
| 2 | 3 |
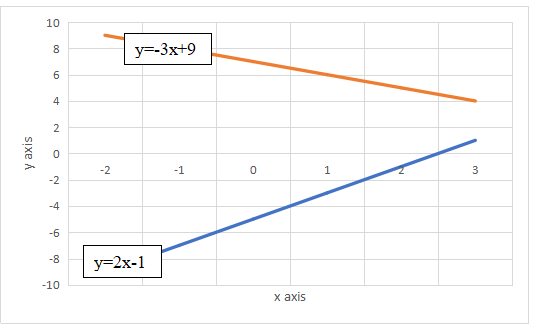
| x | y |
| -2 | 15 |
| -1 | 12 |
| 0 | 9 |
| 1 | 6 |
| 2 | 3 |
- Create a differences table for each of the following relations. Use this table to determine if the relation is linear or non-linear. For the linear relations, develop the equation of relations. You do not need to plot the lines.
a.
| x | y | x difference | y difference |
| 4 | 2 | +2 | +1 |
| 6 | 3 | +2 | +1 |
| 8 | 4 | +2 | +1 |
| 10 | 5 | +2 | +1 |
| 12 | 6 |
Sol. Linear
b.
| x | y | x difference | y difference |
| 1 | 4 | +2 | +10 |
| 3 | 14 | +2 | +10 |
| 5 | 24 | +2 | +10 |
| 7 | 34 | +2 | +10 |
| 9 | 44 |
Sol. : Linear
c.
| x | y | x difference | y difference |
| -3 | -3 | -1 | -2 |
| -2 | -1 | -1 | +2 |
| -1 | 1 | +1 | +2 |
| 0 | 3 | +1 | +2 |
| 1 | 5 |
Sol. : Non-linear
d.
| x | y | x difference | y difference |
| -4 | 8 | -2 | +6 |
| -2 | 2 | -2 | +2 |
| 0 | 0 | +2 | +2 |
| 2 | 2 | +2 | +6 |
| 4 | 8 |
Sol. Non-linear
- Graph each pair of lines on the same set of axes. Determine the point of intersection of two lines. Note that you may have to estimate the coordinates.
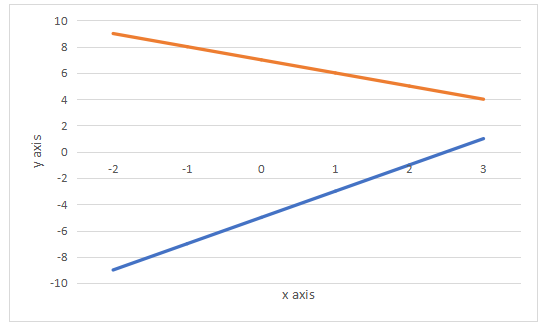
Sol.
point of intersection: (-3,-10)
Sol.
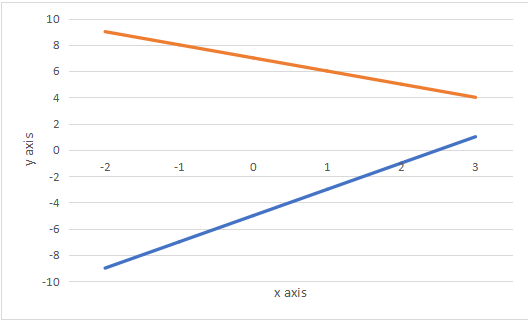
Point of intersection (4,3)
- On the four topics covered in this assignment, please tell us what in this course material was least clear to you, and why. Also, if you found a particular item was presented well for you, let us know. Your responses will help us improve the course.