Introduction
This project’s purpose is to create a website on AWS service and that website will display the numerical data, prediction for twitter sentiment analysis. The code is used for data analysis from Twitter. The first step is to create a role on IAM management console. The s3 management console, lambda management console and IAM management console are used to analyze the Twitter data.
Sentiment Analysis
Initially, download the data from Twitter and it upload the AWS service console (Argumbayeva Baktygul and Naomie Salim, 2015).
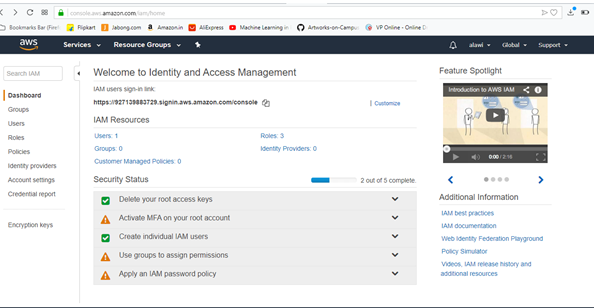
Create a role on IAM management console that uses the sentiment analysis.
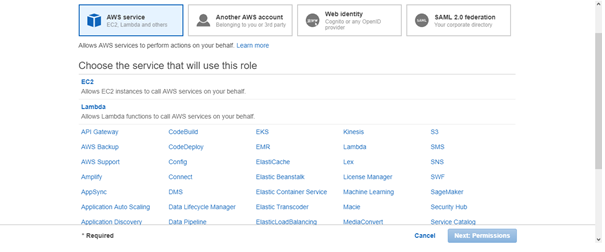
Choose lambda to call the servers.
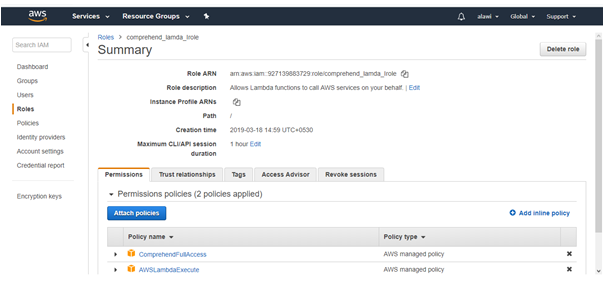
The policies are attached to IMA console data and accesses the data (Chong, 2016).
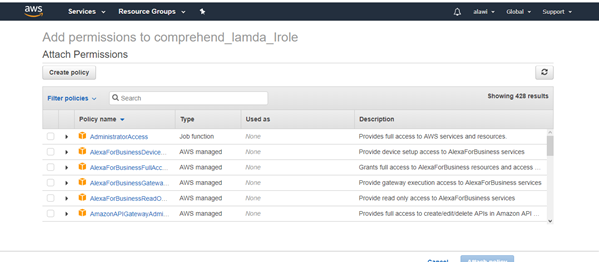
This page creates the policy for accessing the Twitter data.
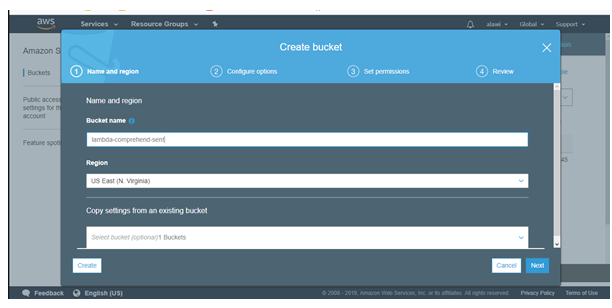
Create bucket s3 management console for uploading the data file.
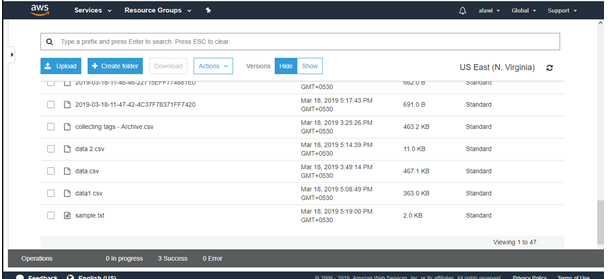
The particular file uploads the data on that page, to analysis the sentiment data.
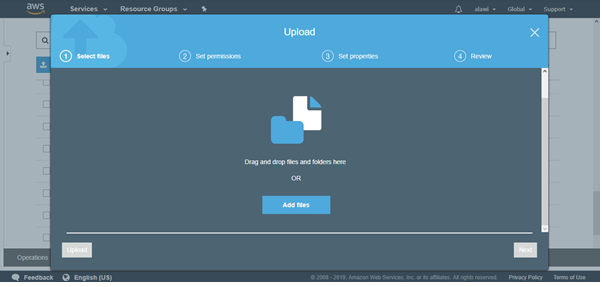
Attach the used Twitter data file and upload the file.

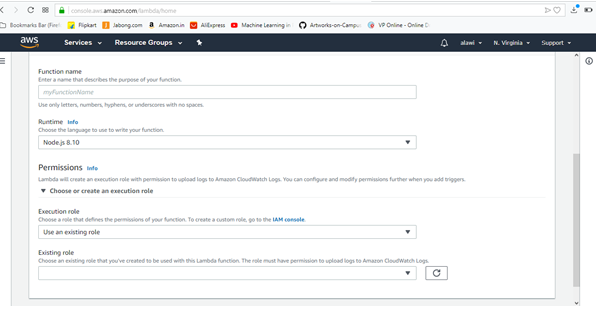
Enter the function name and choose the programming language for creating the function.
Write the programme in this page, then save it and test the program.
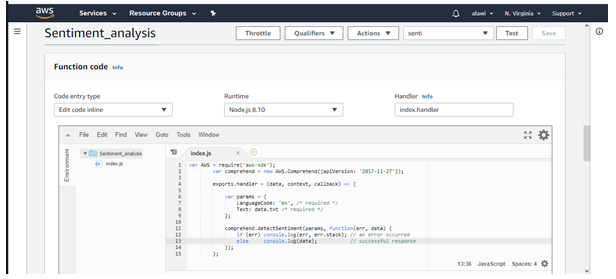
It displays the negative and positive comments.
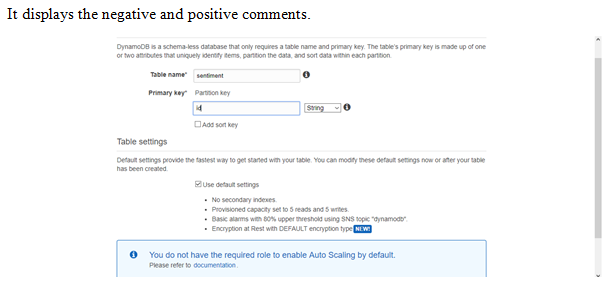
Create DynamoDB for Twitter data.
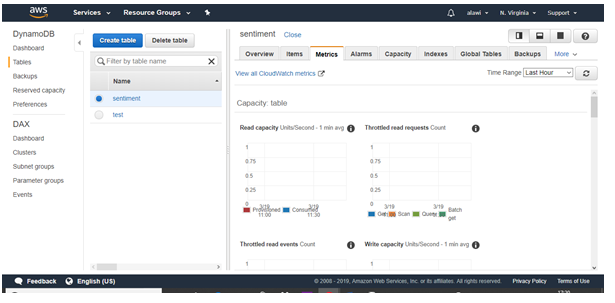
It will display the metrics for Twitter data.
The graph displays the data process for every hour and minute.
Create Website
First step to create the bucket on AWS S3 service and access the arn role.
The s3 bucket name lambda-comprehend-analysis that access by s3 services.
Create the policy for bucket access the webpage.
Generate the policy for lambda function and connect the ARN role.
Give the amazon resource, principal and action for generator the policy then click the add statement.
The policy is automatically generate based on given option and paste the policy on request page.
Click the permission option and go to the static website hosting for access the webpage. The index html code file upload on that page and that access the webpage.
Copy the arn name and pate the url then the website is open.
The database and table are create for backend process. Choose the RDS for create the database and tables that database connect to webpage using JavaScript.
API gateway for http post and get request.
Then create the stack for rollback that connecting the twitter data using twitter keys and tokens.
The keys and token generate on twitter developer page and that keys for connecting stack.
The keys and token store on parameter table.
The data visualization based on the twitter data that display the sentiment analysis chart.
Conclusion
This task is completed successfully, where the sentiment analysis is created for Twitter account. To download the account data and the data is upload on s3 management console. The IAM console is used to create the roles and the function is created on lambda. Finally, the Twitter data analysis is based on negative and positive comments.
References
Argumbayeva Baktygul and Naomie Salim (2015). Twitter sentiment analysis.
Chong, M. (2016). Sentiment analysis and topic extraction of the twitter network of #prayforparis. Proceedings of the Association for Information Science and Technology, 53(1), pp.1-4.