Question 1
Five specific elements that are pivotal to the performance of the company are listed below.
- EBITDA (Earnings before interest, tax, depreciation & amortization) – This is essentially the profits that the company generates from the business. The adjustments of interest, depreciation charges may mislead the investors. This is especially the case when depreciation is quite high since it is a non-cash charge. The importance of EBITDA can be recognised from company D where depreciation charges are significant and tend to significantly underestimate the financial performance.
- Net profits – This is imperative since the earnings per share is determined using the same. The EPS of the company drives the share price and hence the investor returns. Also, the dividend paid to the investors is dependent on net profits as the payout ratio usually remains constant for a company.
- Operating cash flow – The income statement highlights financial performance using accrual accounting which is highly susceptible to irregularities. As a result, it is imperative to consider the operating cash flow and determine if it is healthy or not. A negative operating cash flow on a consistent basis could be very worrisome and reflect a future cash crunch despite the profits in the income statement being healthy.
- Current ratio – The current ratio is computed by dividing current asset by current liabilities. This is an indicator of short term liquidity of the company. It is an important parameter as any significant deterioration of this ratio whereby it links below 1 could imply a cash crunch which may adversely impact normal operations and future expansion.
- Debt equity ratio – This is an indicator of the long term solvency of the company and can be computed by dividing long term debt by the shareholders equity. This is pivotal as it presents an indicator of the extent of leveraging of the balance sheet and thereby indicates the associated financial risk with the business.
Question 2
The ROA may be computed using the following formula.
ROA = Net Income/Average assets
ROA for 2018 (Company C) = (2934/(38999+37431)/2) = 7.68%
ROA for 2018 (Company D) =(-116/(8413+9118)/1) = -1.32%
The decomposed approach to computing ROA is shown below.
ROA = Net profit margin * Total asset turnover
ROA = (Net income/Total revenue) *(Total revenue/Average total assets)
ROA for 2018 (Company C) = (2934/71879)*(71879/(38999+37431)/2) = 7.68%
ROA for 2018 (Company D) = (-116/12506)*(12506/(8413+9118)/1) = -1.32%
Question 3
The formula for RONA is shown below.
RONA = (NOPAT/Average Net Operating assets)
Net operating assets (company C 2018) = 38999-(13201+14089+2643+1264) = 7802
Net operating assets (company C 2017) = 37431-(12707+13771+2512+1169) = 7272
Net operating assets (company D 2018) = 8413 – 7034 = $1,379
Net operating assets (company D 2017) = 9118 – 7764 = $1,354
RONA for 2018 (Company C) = (4312-718)/ (7802+7272)/2= 47.68%
RONA for 2018 (Company D) = (116+126)/(1379+1354)/2 = 17.70%
RONA = Net operating profit margin * Net operating asset turnover
RONA for 2018 (Company C) = [(4312-718)/71879] * [71879/(7802+7272)/2] = 47.68%
RONA for 2018 (Company D) = [(116+126)/12506] * [12506/1379+1354)/2] = 17.70%
Question 4
For company C, the appropriate ending inventory is determined using the LIFO method i.e. last in first out method. Further, the Retail Inventory Accounting Method or RIM is also used by the company. Adjustments for losses in inventory based on markdowns and any shrinkage is carried on periodically. In contrast with company C, the company D tends to either deploy RIM or FIFO method for computing the ending inventory. This difference in inventory accounting treatment may be attributed to the difference in businesses of the two companies.
With regards to depreciation, company C adheres to the straight line method of depreciation over the useful life of the underlying asset or lease term if it is shorter than the useful life. Company D also uses a straight line method of depreciation based on the estimated useful life of the underlying assets.
From the above, it is evident that the depreciation related accounting policy for the two companies is quite similar. With regards to inventory treatment it is noteworthy that the same may be attributed to the difference in nature of business and hence no adjustment is required when comparing the performance of the two companies.
Question 5
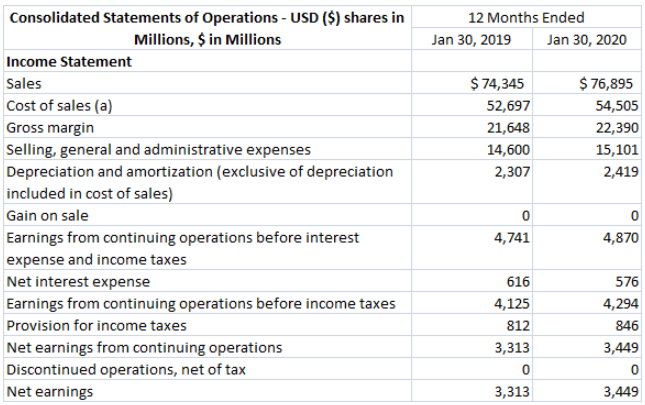
The income statement for company C for the next two years is shown below.
The assumptions for the above estimates are as follows.
- Sales growth for 2019 and 2020 is the same as that in 2018 which is 3.43%.
- The cost of sales for 2019 and 2020 has been taken as the average cost of sales as a % of sales for 2016-2018.
- Gross margin = Sales – Cost of sales
- Selling, administrative and general expenses have been taken as the average of the % of sales for 2016-2018.
- Depreciation and amortization has been obtained by adding the average of the increase in depreciation in 2017 and 2018 to the previous depreciation.
- Gain on sale has been assumed to be zero
- Earnings from continuing operations = Gross margins – selling, administrative and general expenses – depreciation & amortisation + Gain on sale
- Net interest expense has been reduced by $ 50 million in each year from the 2018 levels assuming debt repayment by the company.
- Tax rate has been taken as the rate in 2018 as there seems to have been a reduction in the corporate tax rate in 2018 which now would be used for future years.
The income statement for company D for the next two years is shown below.
The assumptions for the above estimates are as follows.
- Sales growth has been taken as average of 2017 and 2018 sales growth.
- The cost of sales for 2019 and 2020 has been taken as the average cost of sales as a % of sales for 2016-2018.
- Selling, administrative and general expenses have been taken as the average of the % of sales for 2016-2018.
- Pension has been assumed constant at 2018 level.
- There is a decrease of $ 20 million annually in depreciation and amortisation based on the given period trends.
- Net interest expense is declining by $ 25 million annually
- The income tax expense has been computed based on the applicable income tax rates in previous years.
Question 6
A key piece of financial information that is required in order to evaluate the performance of the companies is the industry average for the respective industries that the given companies operate in. This is required since it would enable a comparison of the company with the performance of the industry in various aspects using ratio analysis which would enable identification of strengths, weakness. This would provide a superior understanding of the company’s performance as currently only comparison of 2018 performance with previous years can be done. This year on year comparison may be misleading if the company has been a outperformer or underperformer in the industry.
A key non-financial information which may be useful is the detail on shareholding coupled with previous earnings transcript or management commentary. This is required so as to analyse whether there is any reduction of stake on the end of promoters which would indicate that the business has poor fundamentals and unlikely to improve. This is especially significant considering the sizable underperformance of both the stocks when compared with the benchmark index. Further, the earnings transcript and management commentary would provide vital clues about the execution capability of the management and whether they fulfill their promises or not. This would be vital in determining whether future possibility of turnaround arises or not.
Question 7
I would like to invest in company C over company D on account of the following reasons.
- Company C has been generating stable profits over the2016-2018 period. This is in sharp contrast with company D which has been generating losses or breaking even over the given period.
- Despite company efforts to pay debt, Company D balance sheet is over leveraged which potentially raises questions regarding going concern. The company D is not able to service the interest payments from the operating profits and the debt equity for company D exceeds 2.5. In such circumstances, if the operational performance of company D does not improve in the future, the company may default on the loan repayments. In contrast, company C has healthy operating profits which provide ample coverage for the interest and has comparatively low debt equity ratio.
Company C share price has significantly underperformed the S&P 500 index during the relevant time period and it is possible that future may see significant upside to the stock price.
| Consolidated Statements of Operations – USD ($) shares in Millions, $ in Millions | 12 Months Ended | 12 Months Ended | ||||
| Feb. 03, 2018 | Jan. 28, 2017 | Jan. 30, 2016 | Jan 30, 2019 | Jan 30, 2020 | ||
| Income Statement | Particulars | |||||
| Sales | $ 71,879 | $ 69,495 | $ 73,785 | $ 74,345 | $ 76,895 | Change in sales |
| Cost of sales (a) | 51,125 | 49,145 | 52,241 | 52,697 | 54,505 | Cost of sales asa% of sales |
| Gross margin | 20,754 | 20,350 | 21,544 | 21,648 | 22,390 | SGA as a % of sales |
| Selling, general and administrative expenses | 14,248 | 13,356 | 14,665 | 14,600 | 15,101 | Depreciation |
| Depreciation and amortization (exclusive of depreciation included in cost of sales) | 2,194 | 2,025 | 1,969 | 2,307 | 2,419 | Net interest expense as a %of debt |
| Gain on sale | 0 | 0 | (620) | 0 | 0 | Provision from income taxes as a% of pretax income |
| Earnings from continuing operations before interest expense and income taxes | 4,312 | 4,969 | 5,530 | 4,741 | 4,870 | |
| Net interest expense | 666 | 1,004 | 607 | 616 | 576 | |
| Earnings from continuing operations before income taxes | 3,646 | 3,965 | 4,923 | 4,125 | 4,294 | |
| Provision for income taxes | 718 | 1,296 | 1,602 | 812 | 846 | |
| Net earnings from continuing operations | 2,928 | 2,669 | 3,321 | 3,313 | 3,449 | |
| Discontinued operations, net of tax | 6 | 68 | 42 | 0 | 0 | |
| Net earnings | $ 2,934 | $ 2,737 | $ 3,363 | 3,313 | 3,449 | |
| Basic earnings per share | ||||||
| Continuing operations (in dollars per share) | $ 5.35 | $ 4.62 | $ 5.29 | |||
| Discontinued operations (in dollars per share) | 0.01 | 0.12 | 0.07 | |||
| Net earnings/(loss) per share (in dollars per share) | 5.36 | 4.74 | 5.35 | |||
| Diluted earnings per share | ||||||
| Continuing operations (in dollars per share) | 5.32 | 4.58 | 5.25 | |||
| Discontinued operations (in dollars per share) | 0.01 | 0.12 | 0.07 | 3,594 | ||
| Net earnings/(loss) per share (in dollars per share) | $ 5.33 | $ 4.70 | $ 5.31 | 0.476847552 | ||
| Weighted average common shares outstanding | ||||||
| Basic (in shares) | 546.8 | 577.6 | 627.7 | |||
| Dilutive effect of share-based awards (in shares) | 3.5 | 4.9 | 5.2 | |||
| Diluted (in shares) | 550.3 | 582.5 | 632.9 | |||
| Antidilutive shares (in shares) | 4.1 | 0.1 | 0 | |||
| Dividends declared per share (in dollars per share) | $ 2.46 | $ 2.36 | $ 2.20 |
| CONSOLIDATED STATEMENTS OF OPERATIONS – USD ($) shares in Millions, $ in Millions | 12 Months Ended | 12 Months Ended | |||||||
| Feb. 03, 2018 | Jan. 28, 2017 | Jan. 30, 2016 | Jan 30 2019 | Jan 30 2020 | 2018 | 2017 | 2016 | ||
| Income Statement [Abstract] | Particulars | ||||||||
| Total net sales | $ 12,506 | $ 12,547 | $ 12,625 | $ 12,447 | $ 12,388 | Change in sales | -0.33% | -0.62% | |
| Costs and expenses/(income): | Cost of sales asa% of sales | 0.653606269 | 0.643261337 | 0.639524752 | |||||
| Cost of goods sold (exclusive of depreciation and amortization shown separately below) | 8,174 | 8,071 | 8,074 | 8,034 | 7,996 | SGA as a % of sales | 0.277306893 | 0.281979756 | 0.299009901 |
| Selling, general and administrative (SG&A) | 3,468 | 3,538 | 3,775 | 3,561 | 3,544 | ||||
| Pension | 21 | 19 | 162 | 21 | 21 | ||||
| Depreciation and amortization | 570 | 609 | 616 | 550 | 530 | ||||
| Real estate and other, net | (146) | (111) | 3 | 0 | 0 | ||||
| Restructuring and management transition | 303 | 26 | 84 | 0 | 0 | ||||
| Total costs and expenses | 12,390 | 12,152 | 12,714 | 12,166 | 12,091 | ||||
| Operating income/(loss) | 116 | 395 | (89) | 281 | 297 | ||||
| Loss on extinguishment of debt | 33 | 30 | 10 | 0 | 0 | ||||
| Net interest expense | 325 | 363 | 405 | 300 | 275 | ||||
| Income/(loss) before income taxes | (242) | 2 | (504) | (19) | 22 | 242 | |||
| Income tax expense/(benefit) | (126) | 1 | 9 | (10) | 11 | 0.177094768 | |||
| Net income/(loss) | $ (116) | $ 1 | $ (513) | $ (9) | $ 11 | ||||
| Earnings/(loss) per share: | |||||||||
| Basic (in dollars per share) | $ (0.37) | $ 0 | $ (1.68) | ||||||
| Diluted (in dollars per share) | $ (0.37) | $ 0 | $ (1.68) | ||||||
| Weighted average shares – basic | 311.1 | 308.1 | 305.9 | ||||||
| Weighted average shares – diluted | 311.1 | 313 | 305.9 |