A direct, multimedia communication link is a data link which connects two partners. This link is usually connected via a dedicated line or a network, and it is not supposed to be disconnected. It can as well mean connecting of two or more locations together to reeve and transmit data in a digital form. A link protocol is present and is the one responsible for allowing the transfer of data. For instance, taking a look at the OSI layer, its second layer is the one responsible for the data link and avails the layout for rectification of errors in the physical layer as well as the transfer of data. Additionally, other instances have seen direct data link is defined as an asset of electronic assemblies, which is comprised of a receiver-transmitter and the interconnecting wires [1].
The direct data has multiple applications; for instance, it can be used in the transfer of data, voice data, audio data as well as files. It can as well be used in computer communication. Majority of the point to point direct data link connections relies on superordinate infrastructures, for example, SDH or ATM. A key characteristic is the bit of transparent transfer. Thus, in order to set up direct communication between CPA (Certified Practicing Accountants and Melbourne Institute Technology (MIT), a direct data link should be created between the two parties.
Apparently, there exist three basic types of basic data-link configurations. This confguratio0n can be made us of in the design of the technology of the direct data link communication.
They include;
- Simplex communications, – this implies that all the communications are channeled only in one direction [2].
- Half-duplex communications imply that communication is enabled in both ways but cannot occur concurrently, one has to be made after which the other one responds.
- Duplex communications, this implies that communication is enabled in both ways and can occur concurrently [3].
With this background knowledge, we will then delve into some of the data link layer technologies that are applicable in the industry and then suggest the two best technologies.
Point to point protocol
Since the period of the 1960s, several points to point data link layers have been designed for the transportation of IP packets. The link can be either be a dial-up connection between two communicating hosts by use of a modem, a leased line via a telephone network, or a physical cable. The first one to be designed is the serial line IP which apples a stuffing technique of the IP packets. It operates based on the assumption that two the IP address of two communicating routers have been connected by manual configuration. It only supports IP packets, with a low bandwidth of 20kps. This low bandwidth led to the development of various compression techniques to aid the transfer of the IP packets [4].
Despite its applications, this protocol experienced several limitations such as slow error detection, the infectivity of the compression, cannot allow simplex communication among others. This led to the development of point to point protocol. Also shortened as PPP, this protocol supports a variable length of packets, with a 16nit CRC, which can as well be enhanced to 32 bits Cyclical Redundancy Check [5].
Ethernet
This network protocol was first designed in 19780s and used a coaxial cable in the transfer of data. Its bandwidth at those times was 3mps, which was later improved to 10mps. Its slot time as well as advanced, with a duration time of 51.2-second corresponding to a frame size of 64 bits. Until then, there have been tremendous improvements in terms of various aspects of the data link layer. Currently, the Ethernet field is 32-bit cyclical redundancy check which has the capability of catching a large number of transmission errors as opposed to other protocols [6].
Asynchronous transfer mode
ATM is protocol is a carriage which was used in the transfer of user traffic, including data, voice, and video signals. It offers operations which are similar to packet switching and circuit switching by employing an asynchronous time division multiplexing. This implies that it adopts a different technique concerning the Ethernet and internet protocol [7]
Internet protocol
This protocol is meant to transmit datagrams across various boundaries of networks. The routing functions of internet protocol enable Internet and interworking parameters. It allows for the transfer of data from the host directly to the recipient through means of an IP address.
In terms of the reliability, the IP is termed as unreliable since multiple errors such as packet loss, and data corruption may occur during the relay, which may end up affecting the data on transfer. However, the upper layer protocol in its layer is designed to take care of such incidences [8].
Fiber distributed data interface
This is also a technique used in the transfer of data and files based on an optical fiber connection. It operates in a local area network and can connect to a range of 120 miles. The network is characterized by two rings, such that if the primary ring fails, the secondary acts as a subsidiary. It has a high speed, approximated at 200 Mbps. They also are characterized as reliable with low error rate [9].
Advice and Justification
So far, as the consultant, I would advise the two managers to either opt for Fiber distributed data interface or Ethernet technologies. After consideration of the above available technique, these two are the best since they have got high reliability as well as low error rate. Besides, in terms of security, they are very secure, thus improving the link budget or rather the nominal receive level of the data under the transmission.
PART TWO: DESIGN
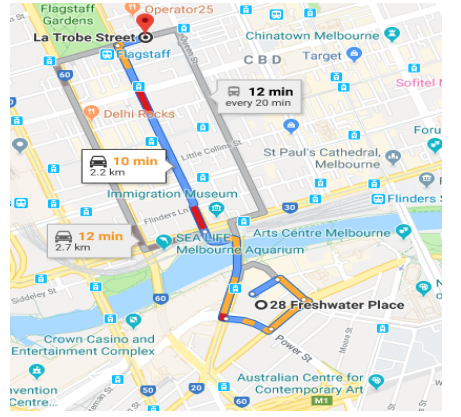
From Google map., the distance between the two places: 28 Freshwater Pl, Southbank, Melbourne VIC 3006 and La Trobe St VIC 3000 Melbourne is 2.2 km, that is when you follow the shortest route, which is via William St. however, the King St/state route seems to be nit longer, recorded as 2.7 kilometers between the two places.
Requirements
| Zone | Distance | Location |
| CPA (Certified Practicing Accountants) | 2.2 km | 28 Freshwater Pl, Southbank, Melbourne VIC 3006 |
| Melbourne Institute Technology (MIT) | exchange of voice, data, images, text, etc.: | La Trobe St VIC 3000 Melbourne |
Idea
- To install a direct multimedia communication link between them for the exchange of voice, data, images, text, etc.:
In order to design a direct communication data link between the two places, an extensive structure design analysis needs to be conducted, factoring all the consideration and possibilities.
This is meant to take care of the user requirements and making the design process more manageable. Thus, using the characteristics of structural analysis design, the design of the network will be conducted in five phases.
Phase 1: Need analysis and requirement gathering
In this phase, a site survey is conducted, for the two clients, whereby all the necessary information to the project is provided. Some of the information which is gathered includes projected growth, application requirements, number of users, and types of equipment’s as well as the existing physical layout of the two stations. Besides, budget constraints, security, and privacy considerations, as well as the reliability, needs to be inquired [10]. Further, a floor plan needs to be obtained for both the buildings. In case there’s no floor plan, a drawing from a technician indication the sizes of the proposed rooms is just enough. Measurements in relation to the cable also need to be made as well as the required hardware and software requirements. The below sample table will direct the survey
Table 1. The analysis report of site survey
| S/N | Requirements | Findings/ response |
| Types of equipment’s | 17 desktops, | |
| Number of users | 17 | |
| Number of printers | 3 | |
| Local servers | None | |
| Application requirements | Running of spreadsheets, AutoCAD, spreadsheets, and graphics applications | |
| WLAN area | Wi-Fi should be accessible within a radius of 100 meters | |
| Security and privacy | There should be restricted access and the security system as much as possible. | |
| Project growth | The likeliness of increasing wireless networks in the future | |
| Physical layout | Rooms are rectangular | |
| Reliability and future expectations | There is a need for high reliability | |
| Email servers | None |
Phase 2: Selection and Design
Based on the findings of the analysis report, devices thus needs to be selected and multiple designs generated. These are meant to have a clear view of LAN in terms of the cost and performances as well as the limitations that are associated. This step involves the interaction of any trade-off, which then needs to be addressed. Some of the factors that are considered during the selection include several ports, costs, manageability, and speed,
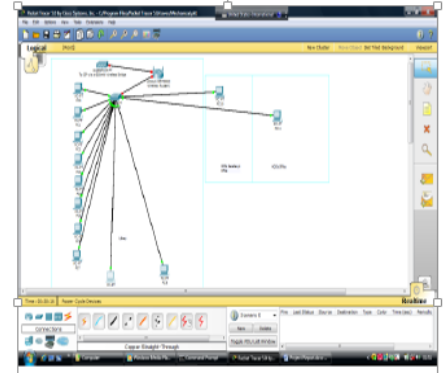
After the selection, prototypes then needs to be created and then tested. Simulator packet tracer tool 5.0 is the best design tool for performing this takes [11].
Based on the values provided in the analysis report, below is a sample simulation of the results.
Determination of bandwidth, network capacity and estimation of the number of users
Bandwidth is the rate of data that the network protocol support expressed in bits per second. It is important to note that the total number of the provided radius by the communications links are not the ones which are received. This is as a result of limiting factors in the hardware as well as the cables and environmental factors [16].
Determination of the network bandwidth will require determination of the available network bandwidth, and then the average utilization which is needed for some of the particular applications. Now, taking an Ethernet network with 12500000 bps, thus.
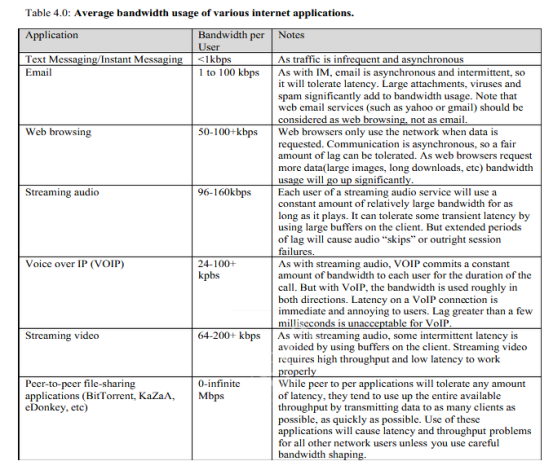
After that, we will determine the amount of bandwidth for each user application. This aid in determining the total number of simultaneous users which can be accepted by the network without any difficulty. Wire shark, a network analyzer is used in bagging packets for determination of the number of bits per second that needs to be relayed across. The figure below illustrates some of the average bandwidth consumptions, which were determined by the wire shark tool [12].

Number of Expected users = available bandwidth / applications
Using the above table as a reference, internet browsing takes between 50 to 100 kbps for every user [15].
The boundaries are then converted into bytes per second.
Using the available bandwidth in equation three above, we obtain
I.e., 100000/6250=16 users and 100000/12500=8 users.
Since there is high likeliness that the users will utilize the internet concurrently, there is a need to enable more users to be accommodated by the bandwidth. This can be possible by monitoring the throughput all over the network by over-subscribing with a factor of 5. For this case, a factor of 2.5 has been used, allowing approximately 17 users.
Phase 3: implementation
Tasks which, might have been overlooked in the first two phases need to be corrected at this phase. A proper implementation schedule help in managing some of the unforeseen events in the design of the network. In this phase, there should be strict adherence to the various codes and standards. By extension, regular consultations with clients are essential [13].
Phase 4: operation
This is the phase where the designed network is brought into use. There are no such considerations in this phase.
Phase 5: evaluation and review of the design
In this phase, an analysis is done to know the user experience. This helps in understanding whether the models following the goals. The system variations should be noted down so that every detail is documented and accounted for. Besides, an analysis in terms of the actual deployments and the projected design cost done for purposes of future projects [14].
References
- Almeida, Álvaro J., Ali Shahpari, Zoran Vujicic, Yahya Sheikhnejad, Francisco Rodrigues, and António L. Teixeira. “Simplified model for power penalty when using PIN and APD receivers.” Optics Communications 392 (2017): 15-19.
- Ayub, Kamran, and Valerijs Zagurskis. “Technology implications of UWB on wireless sensor network-a detailed survey.” International Journal of Communication Networks and Information Security 7, no. 3 (2015): 147.
- Bates, Oliver, Carolynne Lord, Bran Knowles, Adrian Friday, Adrian Clear, and Mike Hazas. “Exploring (un) sustainable growth of digital technologies in the home.” In EnviroInfo and ICT for Sustainability 2015. Atlantis Press, 2015.
- Chang, Yue. “Ethernet switching and forwarding method, system and apparatus.” U.S. Patent 8,072,984, issued December 6, 2011.
- Ghoshal, Sajol, and John R. Camagna. “Ethernet module.” U.S. Patent 7,761,719, issued July 20, 2010.
- Iannone, Eugenio. Telecommunication networks. CRC Press, 2016.
- Ishii, Kiyo, Junya Kurumida, Ken-ichi Sato, Tomohiro Kudoh, and Shu Namiki. “Unifying top-down and bottom-up approaches to evaluate network energy consumption.” Journal of Lightwave Technology 33, no. 21 (2015): 4395-4405.
- Janacek, S., D. Schlitt, and G. Schomaker. “The Energy Demand of Data Centers.” ICT Innovations for Sustainability. Springer Series Advances in Intelligent Systems and Computing. Springer, Heidelberg (2014).
- Muciaccia, Tommaso, Fabio Gargano, and Vittorio MN Passaro. “A TWDM-PON with advanced modulation techniques and a multi-pump Raman amplifier for cost-effective migration to future UDWDM-PONs.” Journal of Lightwave Technology 33, no. 14 (2015): 2986-2996.
- Nikolić, Dino-Solar, Marija Trifunović, Predrag Milićević, Predrag Milosav, and Miroslav Perić. “Methodology for used cryptographic key verification in multi Gbit/s encryption systems.” In 2016 24th Telecommunications Forum (TELFOR), pp. 1-4. IEEE, 2016.
- Reviriego, Pedro, Ken Christensen, Juan Rabanillo, and Juan Antonio Maestro. “An initial evaluation of energy efficient Ethernet.” IEEE Communications Letters 15, no. 5 (2011): 578-580.
- Robitaille, Claude, Patrick Ostiguy, Nicolas Cote, Steve Rochon, and Dominique Bastien. “Power over ethernet management devices and connection between ethernet devices.” U.S. Patent 7,873,057, issued January 18, 2011.
- Ružbarský, J., Ľ. Ovseník, and J. Turán. “Optical AddDrop multiplexers for all-optical fiber communication.” MIPRO, 2015.
- Schien, Dan, and Chris Preist. “Approaches to energy intensity of the internet.” IEEE Communications Magazine 52, no. 11 (2014): 130-137.
- Schien, Daniel, and Chris Preist. “A review of top-down models of internet network energy intensity.” In ICT for Sustainability 2014 (ICT4S-14). Atlantis Press, 2014.
- Schien, Daniel, Paul Shabajee, Stephen G. Wood, and Chris Preist. “A model for green design of online news media services.” In Proceedings of the 22nd international conference on World Wide Web, pp. 1111-1122. ACM, 2013.
- Winzer, Peter J. “Beyond 100G ethernet.” IEEE Communications Magazine 48, no. 7 (2010): 26-30