Overview
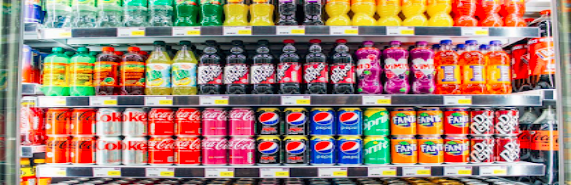
Different people across the globe have a variety of preference when it comes to carbonated or soft drinks brands. For instance, coca cola, Pepsi , Fanta, sprite, beers among others. Sparkling refreshments, frequently referred to as fresh drinks, are primarily composed of carbonated beverages. These cells or bubbles are generated when carbon monoxide (CO2) absorbs in a solution. Since the gas carbon dioxide is only occasionally dissolves in water, when its pressure diminishes, it transforms into a gas.
The survey study carried out between pepsi drink and coca cola shows that the most common drink preferred is coca cola, even though it faces a stiff competition from brand Pepsi, since the tastes are almost similar.
Description in the market
Coca-Cola is the major beverage producer and supplier globally, as well as one of the largest business enterprises in the US, and it has produced some of the most profitable companies in terms of advertising history, with over 500 distinct products readily available in over 200 nations. The company’s primary headquarters is based in Atlanta, Georgia.

‘Taste the Feeling’ is the most recent advertisement slogan from Coca-Cola Specialists in marketing weighs in, As a component of a fresh approach aimed at bringing the company’s brands together worldwide, Coca-Cola has updated its motto from “Open Happiness” to “Taste the Feeling,” spanning 17 years.
After a half-century, Coca-Cola continues to thrive strong (Hymson, 2011). Based on the market assessment, Coca-Cola US rated as the twenty-eighth greatest organization in global commerce in 2022 and dominated the marketplace for carbonated beverages (Lim, 2022).
It possesses a worldwide market value of approximately 89 billion dollars as well as is often acknowledged as the best energy drink product in the entire globe.
Description Of The Brand Performance
In accordance with the Secondary statistical data, Coca-Cola constitutes 43.7% of global revenue in the alcohol-free refreshment category. the company’s 2023 earnings totaled $45.754 billion, gaining 6.39% over the year prior. Its 2022 gross revenue was $43.004 billion, adding 11.25% over the same period last year. The drinks company’s 2021 profit of $38.655 billion marked a 17.09% growth during 2020.
The company increases its market share through advertisement: Coca-Cola can connect with an enormous demographic while creating popularity owing to its significant expenditure on advertisements. As a result of its scope, the company is able to distribute the price of marketing across an extensive range of items, which reduces the rate per capita.
Specific Marketing Challenges
Buyers occasionally purchase little on non-essential products like refreshing beverages whenever economic conditions is unreliable, which may negatively impact the company’s revenue and profitability. Similarly, growing consumer demands and flavors, for instance an evolution regarding cleaner drinks substitutes as well as a boost of ecological consciousness affects the brand premium. Successful supply chain administration is becoming difficult for the company to accomplish given the threat of unanticipated disturbances caused by ecological calamities and turmoil in politics, and additional barriers to regulating the social and ecological effects of its operations. This has led to the business’s activities to be hampered and its expenses have risen.
Description Of Conjoint Analysis
Conjoint analysis provides viable options and advertises responses from consumers to allocate ratings to multiple aspects of the product and grades. Companies can utilize it for making judgments that reflect precise findings from data on clients through the numerical assessment of user or client conduct.
Conjoint Analysis
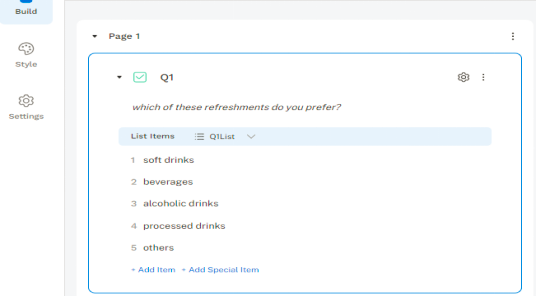
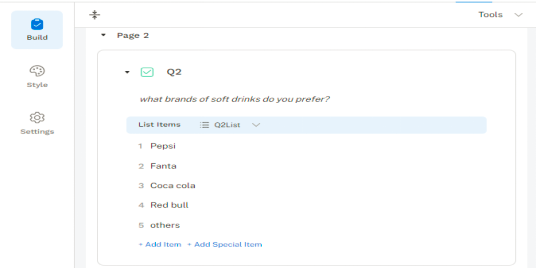
Below is a sample conjoint analysis survey for soft drinks (Pepsi and Coca-Cola) using Sawtooth software. This survey includes a series of questions to gather respondents’ preferences for different attributes of soft drinks. The necessary diagrams for analysis are also outlined.
Conjoint Analysis Scenarios:
Sample Questions in Sawtooth Discovery software

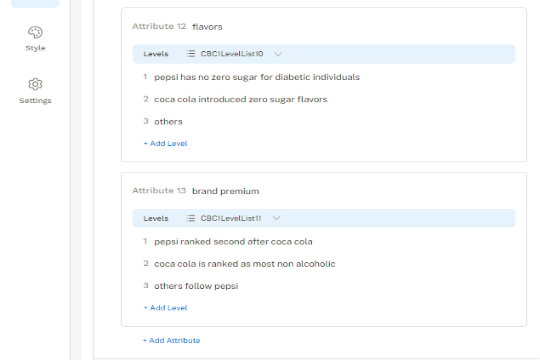
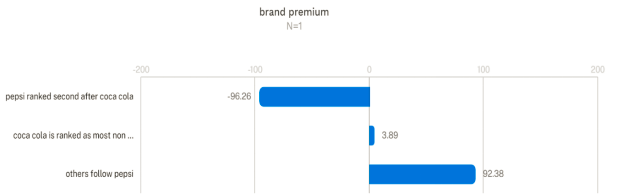
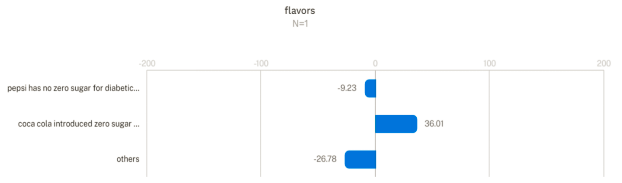
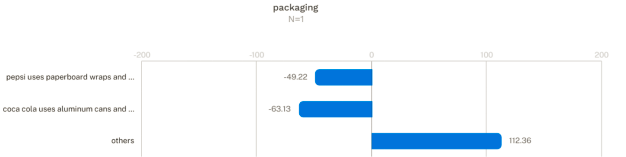
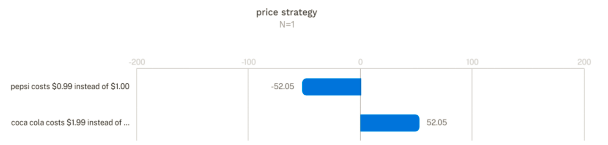
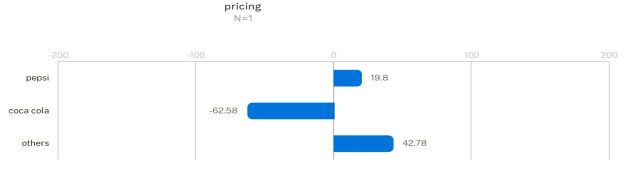
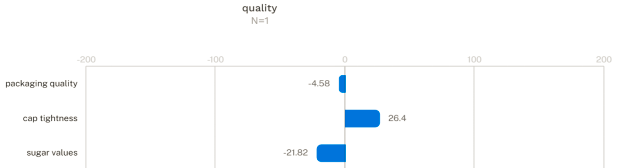
Results of the Simulation from Sawtooth Discovery Software
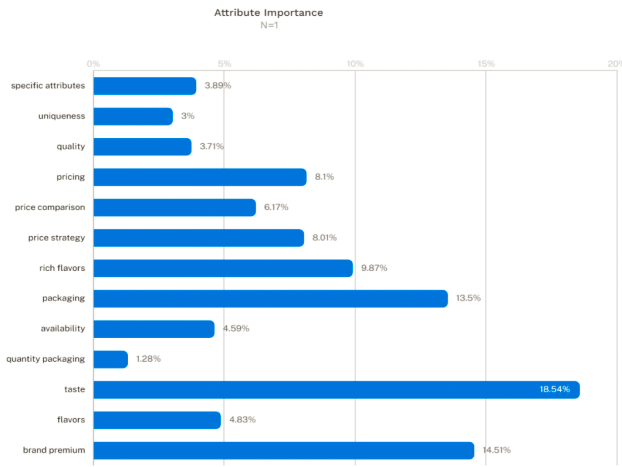
Fig. 1. CBC 1 – Attribute Importance Chart


Conclusion
Based on the survey conducted using Sawtooth Software and analyzing market attributes such as pricing, taste, and others, several conclusions can be drawn:
Price Sensitivity: The survey likely revealed insights into how consumers perceive pricing in relation to the product’s value proposition. This could include identifying price points that are perceived as too high or too low, as well as understanding the willingness of consumers to pay more for added benefits or features.
Preference Mapping: By analyzing responses to various attributes such as taste, quality, convenience, and branding, the survey likely generated preference maps. These maps can provide insights into the relative importance of different attributes to consumers and how they trade off between them when making purchasing decisions.
Market Segmentation: Through statistical analysis, the survey may have uncovered distinct market segments with different preferences and buying behaviors. Understanding these segments allows for more targeted marketing strategies and product offerings tailored to the needs and preferences of each group.
Competitive Analysis: The survey results can shed light on how the product fares against competitors in terms of perceived value, pricing, and other attributes. This information is crucial for identifying areas where the product excels and where it may need improvement to remain competitive in the market.
Forecasting Demand: By extrapolating survey responses, it’s possible to estimate future demand for the product under different scenarios, such as changes in pricing or the introduction of new features. This information is invaluable for strategic planning and decision-making.
Actionable Insights: Ultimately, the survey should provide actionable insights that can inform marketing strategies, product development efforts, pricing decisions, and other aspects of the business. These insights enable companies to better meet the needs and preferences of their target market, ultimately driving growth and profitability.
In conclusion, the survey conducted using Sawtooth Software offers valuable insights into consumer preferences, market dynamics, and competitive positioning, empowering businesses to make informed decisions that drive success in the marketplace.
Top of Form
References
Lim, D. (2022). Trademark Confusion Simplified: A New Framework for Multifactor Tests. Berkeley Tech. LJ, 37, 867. https://heinonline.org/HOL/LandingPage?handle=hein.journals/berktech37&div=27&id=&page
Hymson, L. A. (2011). The Company that Taught the World to Sing: Coca-Cola, Globalization, and the Cultural Politics of Branding in the Twentieth Century (Doctoral dissertation). https://deepblue.lib.umich.edu/handle/2027.42/86471