Task 1
| Column 2 | Column 3 | Column 4 | Column 5 | Column 6 | |
| Minimum | 26.0001 | 0.0017 | 50.009 | 0.6912 | -0.001 |
| Maximum | 39.7800 | 149.994 | 317.4994 | 17.2774 | 0.3907 |
| Average | 32.1699 | 66.1871 | 171.2690 | 5.5942 | -3.3909 |
Task 2
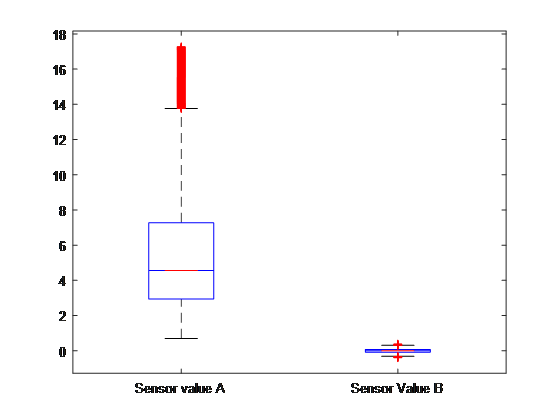
The Box Whisker plot indicate that, generally the sensor values A are greater than those of B. The graph also shows that sensor value B are more centralized about its own mean as compared to those of A.
Task 3
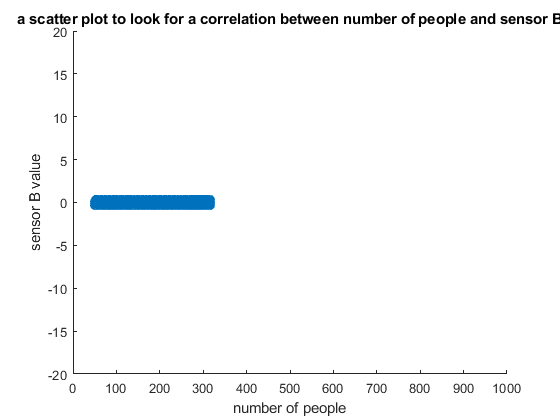
The graph shows that the two variables are not correlated since a change in number of people does not lead to a significant change in the sensor value A. This is shown by an almost horizontal line whose gradient is almost zero if a least square line is to be fitted.
Task 4
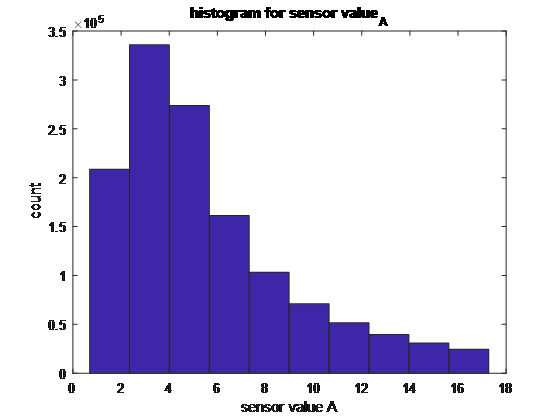
The histogram is right skewed with a peak on the left of its center with more gradual tapering to the right side. This indicator that the sensor value A represents a unimodal dataset with the mode closer to the side of the graph with the mode being smaller than the median or the mean
Part 2
Task 1a
Task 1b
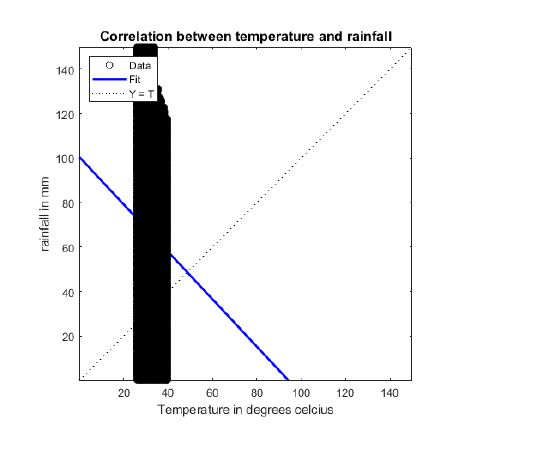
Task 2a
The correlation between temperature and rainfall in the given data set is …
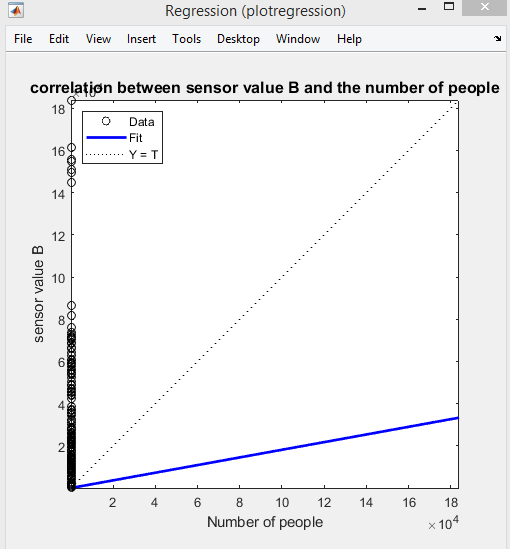
Task 2b
The correlation between Sensor b and the number of people in the given data set is -0.082539.
The increase in temperature does not lead to a significant change in rainfall. However, as temperature increase, a small decline is observed in the rainfall received in a location.
Correlation factor =0.01813
The correlation factor is positive. The magnitude is however small implying that as the number of people increases, there is slight increase in the sensor value B
Task 3
The expected temperature for an area with a rainfall between 15 and 50mm is xxxxx
Add a plot/table of your choice to highlight how you came to your result.
Consider a regression result shown below
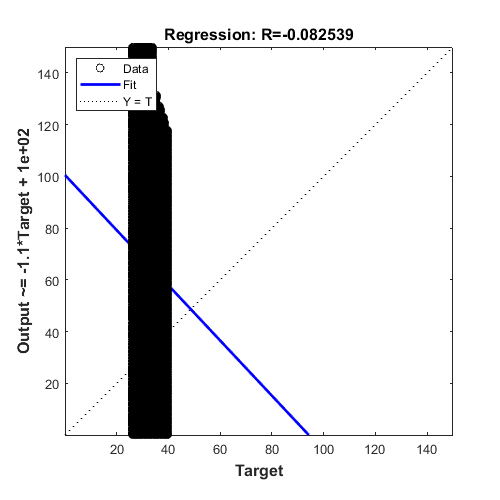
The output =rainfall while the target is temperature
From the regression output equation, we have
When rainfall=15mm
When rainfall=50mm
The expected temperature for an area with a rainfall between 15 and 50mm is 13.63 and 84.16 degrees Celsius
Part 3
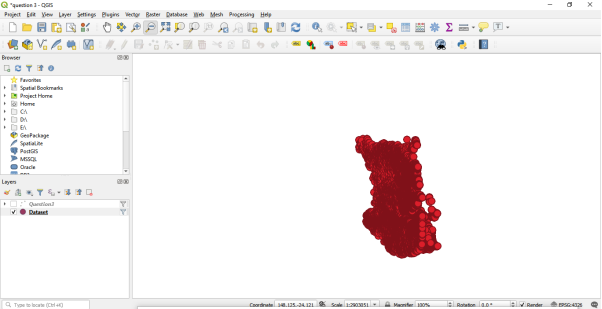
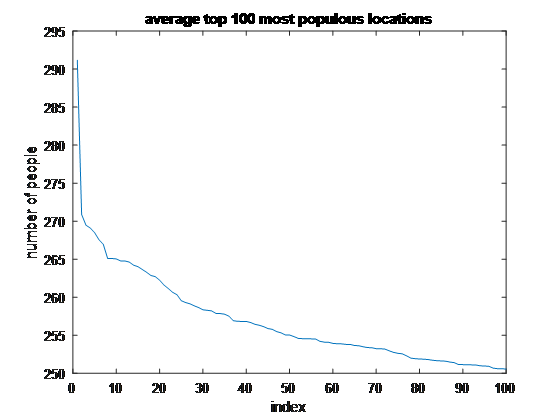
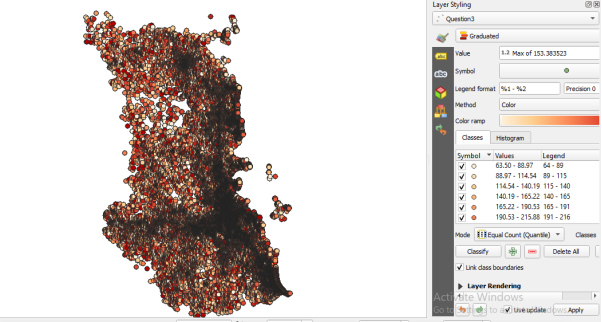
Task 1
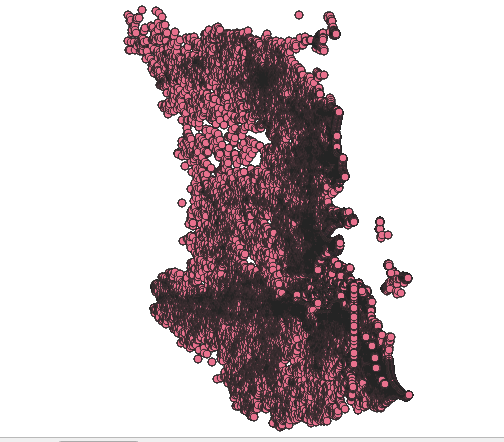
Just a sample, you should display the whole area
Just a sample, you should display the whole area
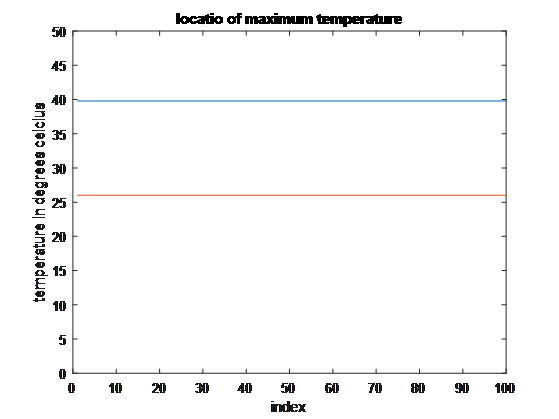
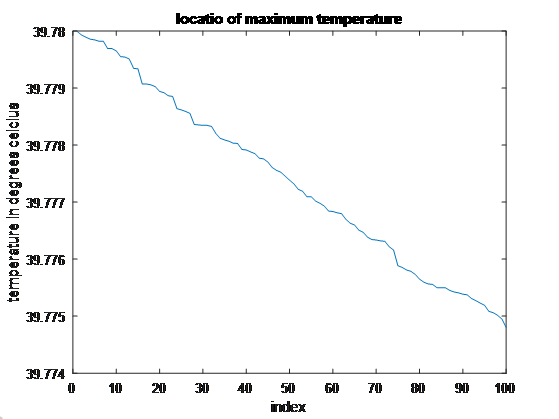
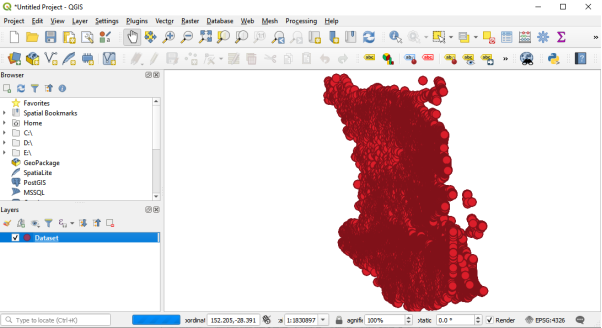
Task 3
Just a sample, you should display the whole area
Task 4