Introduction
The report aims to present a diversified portfolio created by selection of 20 stocks which is split between UK stock exchange and Singapore Stock Exchange. 10 Stocks have been selected from Singapore Stock Exchange and 10 stocks have been selected from UK Stock Exchange. These stocks have been selected based on fundamental analysis. The objective of stock selection is to maximise return and beat the respective index. Further, a comparison has been made on the basis of risk and return of this portfolios. Also, based on returns an explicit comment has been made on the efficient market hypothesis.
An investment of $ 200,000 has been made for 20 stocks. The portfolio is equal weighted i.e. $ 10000 has been invested in each stock. The trading timeframe is 23rd October, 2023 to and the end day is 09th February 2024. The trading time frame is short term.
Rationale for stock selection
Fundamental analysis-based stock selection entails a careful assessment of a company’s financial standing, industry standing, business strategy, and prospects for future expansion. This strategy’s justification is to find equities with solid fundamentals that are currently undervalued by the market, indicating that they will eventually yield higher returns. The following are important factors taken into account while choosing stocks using fundamental analysis:
(a) Financial Health: Examine the income, balance, and cash flow statements as well as other financial statements of the business. Seek out businesses with solid balance sheets (low levels of debt, high liquidity), steady revenue growth, robust profit margins, and positive cash flows.
(b) Quality of Earnings: Evaluate the quality of earnings to make sure they are not artificially inflated by accounting tricks and are sustainable. Good profit are backed by cash flows
(c) Valuation: Use valuation metrics such as Price-to-Earnings (P/E), Price-to-Book (P/B), Price-to-Sales (P/S), and Price/Earnings to Growth (PEG) ratios to determine if the stock is undervalued compared to its historical averages, its sector, or the overall market.
(d) Identifying firms possessing a resilient competitive advantage, or a “moat,” crucially shields them from rivals and sustains profitability. This advantage could stem from robust brand recognition, proprietary technological advancements, secured regulatory licenses, or market dominance.
(e) Assessing the growth prospects of an industry and the company’s standing within it is paramount. Industries with substantial barriers to entry are preferred, as are companies either leading or positioned to ascend to leadership roles within their sectors.
(f) The efficacy of a company’s management team warrants scrutiny, considering their track record and expertise. Competent leadership is pivotal in propelling growth and adeptly steering through challenges.
(g) A comprehensive grasp of the macroeconomic and geopolitical milieu is imperative to gauge its ramifications on the company’s operations. Factors such as interest rates, inflation, regulatory shifts, and technological progressions necessitate consideration.
(h) Emphasizing companies with evident avenues for growth is essential, whether through expanding market foothold, venturing into new markets, introducing novel products, or refining operational efficiencies.
A summary of key analysis of stock selected has been presented as under:
| Identifier (RIC) | Company Name | Market Cap (usd) | EBITDA Margin, Percent (FY0) | Operating Profit Margin, Percent (FY0) | Income Aft Tax Margin, % (FY0) | Asset Turnover (FY0) | ROA Total Assets Percent, Trailing 12 Months (FI0) | ROE Common Equity %, TTM (FI0) | Earnings Retention Rate, % (FY0) | WC/Sales (FY0) |
| DBSM.SI | DBS Group Holdings Ltd | 67,07,49,18,175 | 71.0% | 51.3% | 44.9% | 1.4% | 16.8% | 0.5% | ||
| OCBC.SI | Oversea-Chinese Banking Corporation Ltd | 44,96,32,49,148 | 117.3% | 99.5% | 84.9% | 1.3% | 13.3% | 0.5% | ||
| UOBH.SI | United Overseas Bank Ltd | 36,50,28,83,563 | 53.4% | 48.9% | 40.8% | 1.1% | 12.7% | 0.5% | ||
| SGXL.SI | Singapore Exchange Ltd | 7,56,57,61,647 | 57.6% | 48.5% | 47.8% | 0.3 | 15.5% | 35.5% | 0.4% | 52.4 |
| WLIL.SI | Wilmar International Ltd | 16,22,99,28,785 | 5.1% | 4.4% | 2.5% | 1.1 | 2.7% | 7.6% | 0.5% | 5.5 |
| SIAL.SI | Singapore Airlines Ltd | 14,22,25,23,783 | 26.8% | 15.4% | 12.2% | 0.4 | 5.5% | 13.2% | 0.5% | 43.5 |
| KPLM.SI | Keppel Ltd | 9,90,92,78,911 | 19.4% | 15.4% | 13.3% | 0.2 | 3.2% | 7.9% | 0.3% | 26.7 |
| STEG.SI | Singapore Technologies Engineering Ltd | 9,21,06,24,449 | 13.7% | 8.3% | 6.0% | 0.7 | 4.0% | 24.1% | 0.2% | -12.7 |
| SCIL.SI | Sembcorp Industries Ltd | 6,75,83,40,980 | 23.3% | 16.8% | 14.9% | 0.4 | 6.7% | 23.8% | 0.8% | -7.2 |
| SEAT.SI | Seatrium Limited | 4,54,54,21,677 | 0.5% | -24.3% | -26.8% | 0.6 | -15.4% | -37.9% | -1.2 |
| Identifier (RIC) | Company Name | EBITDA Margin, Percent (FY0) | Operating Profit Margin, Percent (FY0) | Income Aft Tax Margin, % (FY0) | Asset Turnover (FY0) | ROA Total Assets Percent, Trailing 12 Months (FI0) | ROE Common Equity %, TTM (FI0) | Earnings Retention Rate, % (FY0) | WC/Sales (FY0) |
| AZN.L | AstraZeneca PLC | 30.2% | 17.9% | 13.0% | 0.5 | 6.0% | 15.6% | 0.2% | -10.0 |
| GSK.L | GSK plc | 35.9% | 22.2% | 17.5% | 0.5 | 8.9% | 41.2% | 0.5% | -7.4 |
| SHEL.L | Shell PLC | 19.6% | 9.6% | 6.2% | 0.7 | 4.6% | 10.3% | 0.6% | 13.2 |
| UL | Unilever PLC | 19.3% | 16.1% | 12.0% | 0.8 | 9.3% | 34.9% | 0.3% | -10.0 |
| HSBA.L | HSBC Holdings PLC | 63.9% | 36.7% | 29.7% | 0.8% | 13.8% | 0.5% | ||
| BP.L | BP PLC | 22.8% | 11.8% | 7.7% | 0.7 | 5.7% | 22.4% | 0.7% | 6.4 |
| DGE.L | Diageo PLC | 34.6% | 29.0% | 22.0% | 0.5 | 8.6% | 40.7% | 0.5% | 28.1 |
| BATS.L | British American Tobacco plc | 49.2% | -57.3% | -52.0% | 0.2 | -10.4% | -22.5% | -7.2 | |
| GLEN.L | Glencore PLC | 6.3% | 2.5% | 1.5% | 1.7 | 2.5% | 9.2% | 1.0% | 5.9 |
| RIO.L | Rio Tinto PLC | 43.8% | 27.4% | 18.4% | 0.5 | 9.9% | 19.1% | 0.3% | 14.9 |
Selection Strategy & About the company
All the companies have been selected based on fundamentals as disclosed above and market ratios. These companies have either low Price Earnings Ratios or have a potential to rise further,
DBS Group Holdings Ltd operates as a commercial bank and financial services provider across Singapore, Hong Kong, Greater China, South and Southeast Asia, and globally. Its segment includes consumer banking/wealth management, institutional banking, and treasury markets, offering a range of banking, investment, and financial solutions to individual and corporate clients since 1968 and is headquartered in singapore. Its market capitalization is SGD 90.205B with P/E ratio is 9.01.
OCBC offers financial services across various regions, serving individual customer and businesses. Its segments include Global consumer/private banking, global wholesale banking, Global markets, Insurance, and others, providing a range of banking, investment, and insurance products. Established in 1912 and is headquartered in Singapore. Its market capitalization is SGD 60.012B with P/E ratio of 8.29.
UOB, headquartered in Singapore, operates via three segments: Group Retail (GR), Group Wholesale Banking (GWB), and Global Markets (GM). GR serves individual customers globally with diverse banking services. GWB caters to corporate and institutional clients with loans, trade services, and capital market solutions. GM offers treasury services across various asset classes. Its market capitalization is SGD 48.82B with P/E ratio of 5.79.
SGXL operates as a market infrastructure company for securities and derivatives. Its activities include investment holding, treasury management, and providing management services. Its segment include fixed income, currencies and commodities, equities cash, equities – derivatives , platform and others, and corporate. It is headquartered in Singapore with market capitalization of SGD 10105.59 mil and P/E ratio of 18.06.
WLIL, headquartered in Singapore, operates in various segments: Food Products, Feed and Industrial Products, Plantation and Sugar Milling, and others. It processes and distributes edible food products, animal feeds, agricultural commodities, and oleochemicals. Additionally, it engages in oil palm plantation, sugar milling, logistic services, and investment activities. Its market capitalization is SGD 21.71B with P/E ratio of 10.39
Singapore Airlines Limited (SIAL) is an airlines company engaged in the business of passenger and cargo air transportation. The company has various subsidiaries which provides services like provides cargo air transportation, engineering services, training of pilots, air charters, tour activities, the sale of merchandise, and related activities. It also manufacture aircraft cabin equipment, refurbishes aircraft galleys, provides technical and non-technical handling services, and repairs and overhauls hydro-mechanical aircraft equipment. The company has a market capitalisation of SGD 19.02 Billion with a PE of 7.12
Keppel Ltd., formerly Keppel Corporation Limited is an investment holding company and a management company. The company segment includes Energy & Environment; Urban Development; Connectivity; Asset Management, and Corporate & Others. The Asset Management segment includes management of private funds and listed real estate investment and business trusts. The company has a market capitalistion of SGD 13.25 Billion with a PE of 14.83
Singapore Technologies Engineering Ltd (ST Engineering) is a leading integrated engineering group based in Singapore. Founded in 1967, the company has grown into one of the largest and most diversified engineering conglomerates in Asia. ST Engineering operates through various business segments, including Aerospace, Electronics, Land Systems, and Marine. STEG ha a market capitalization of SGD 12.32 billion and has a PE of 21.08
Sembcorp Industries Ltd (SCIL) is a leading company engaged in energy, water and urban development headquartered in Singapore. It operates across Asia, Africa and the Middle East. SCIL focuses on sustainable solutions, including power generation, water treatment, and integrated urban development projects, contributing to economic and environmental progress. It has a market capitalisation of SGD 9.024 Billion with a PE of 9.94.
Seatrium Limited is a dynamic maritime services provider, offering comprehensive solutions in vessel management, crewing, and logistics. With a commitment to excellence, Seatrium leverages cutting-edge technology and industry expertise to ensure efficient operations and client satisfaction in the ever-evolving maritime sector. It has a market capitalisation of USD 5.73 Billion.
AZN is a global biopharmaceutical leader focused on innovating, developing, and commercializing prescription medicines in Oncology, Rare Diseases, and Biopharmaceuticals. The company has its headquarters in United Kingdom and is listed on London Stock Exchange. The market cap of the company is GBP 159.58 Billion with a PE ratio of 34.38.
GSK plc is one of the most globally recognized biopharma company with its operations into segments which includes Commercial Operations and Research and Development. The company is focused on developing cancer medicines for patients, including ovarian cancer, endometrial cancer, and multiple myeloma. The company has its headquarters in United Kingdom and is listed on London Stock Exchange. The market cap of the company is GBP 67.91 Billion with a PE ratio of 13.72.
Shell plc is an energy and petrochemicals company with a focus on exploration, production, refining and marketing of oil and natural gas and the manufacture and marketing of chemicals. The company’s business areas include integrated gas, upstream, marketing, chemicals and products, renewables and energy solutions as well as corporate activities. The company has its headquarters in United Kingdom and is listed on London Stock Exchange. The market cap of the company is GBP 164.16 Billion with a PE ratio of 11.51.
Unilever PLC is a fast-moving consumer goods (FMCG) company which operates in segments like Beauty & Wellbeing, Personal Care, Home Care, Nutrition and Ice Cream. The segments includes wide range of products such as hair care (shampoo, conditioner, styling), skin care (face, hand and body moisturizers), skin cleansing (soap, shower), deodorant and oral care (toothpaste, toothbrush, mouthwash) products and various others. The company has its headquarters in United Kingdom and is listed on NASDAQ. The market cap of the company is USD 122.77 Billion with a PE ratio of 17.55.
HSBC is engaged in the sector of banking and financial services which operates in segments like Wealth and Personal Banking, Commercial Banking and Global Banking and Markets. All these segments provide services like retail banking, wealth management services, including insurance and investment products, credit and lending, international trade and receivables finance, commercial insurance and investments, tailored financial solutions to government etc. The company has its headquarters in United Kingdom and is listed on London Stock Exchange. The market cap of the company is GBP 113.63 Billion with a PE ratio of 6.70.
BP Plc provides energy products and services to its customers and is operating in segments like gas & low carbon energy, oil production & operations and customers & products. The oil production and operations segment includes regions with upstream operations that mainly produce crude oil including bpx energy. Customers & products segment includes its customer-centric businesses such as convenience and retail, EV charging and Castrol as well as aviation and business to business and midstream. The company has its headquarters in United Kingdom and is listed on London Stock Exchange. The market cap of the company is GBP 83.10 Billion with a PE ratio of 7.26.
Diageo plc is an international manufacturer and distributor of premium drinks. The Company’s primary products include scotch whisky, other whisk(e)y, vodka, tequila, gin, rum, liqueurs, beer, wine, and no and low alcohol. The Company’s brands include Johnnie Walker, Tanqueray, Smirnoff, Guinness, Baileys, among others. The company has its headquarters in United Kingdom and is listed on London Stock Exchange. The market cap of the company is GBP 64.84 Billion with a PE ratio of 20.94.
BAT is a consumer-focused company offering tobacco and nicotine products across segments like the United States, Asia Pacific Middle East and Africa, Americas and Europe. Product categories encompass Vapor, THPs, Modern Oral, Traditional Oral, and Combustible Cigarettes, featuring brands such as vuse, glo, and Newport. It is headquartered in United Kingdom (UK) with market capitalization of GBP 52345.45 Mil.
Rio Tinto Group (RIO) is a global mining and metals corporation headquartered in London, UK. Operating in over 35 countries, RIO is a major producer of essential commodities such as iron ore, aluminium, copper, and diamonds. Renowned for its commitment to sustainable mining practices, RIO prioritizes safety, environmental stewardship, and community engagement. It is listed in NYSE with a market capitalisation of USD 100.963 Billion with a PE of 10.09
Glencore plc, based in Zug, Switzerland, is a global natural resources company operating in 50 countries. It’s a major producer and marketer of commodities like copper, coal, and oil. With a focus on responsible practices, Glencore’s integrated model encompasses mining, processing, and trading, ensuring a diverse and resilient portfolio. It has a market capitalisation of USD 65.513 Billion with PE of 15.85.
Trading Strategy
Active and Passive management of investment represents two different approaches of how an investment can be made in the financial markets each having a different perspective, their own philosophy, strategies and outcomes.
Active management involves a hands-on approach in which the investment professionals or fund managers aggressively purchase and sell securities so as to exceed a specified benchmark index and obtain an absolute results. In order to identify the securities that are mispriced due to inefficiencies of the market, these mangers and professional conduct an in-depth research, do market evaluation and take use of their experience in the market. On a frequent basis, they take part in the timings of the market, industry rotation and selection of individual stocks which demands analysis of various scenarios in the market and potential to generate alpha or excess returns for the investors.
One of the key benefits of active management is that it provides an opportunity to earn higher returns. This is beneficial for those skilled and efficient investors who are able to capitalize on the opportunities, adapt to the changing conditions in the market and are able to prevent negative consequences more effectively.
Passive management on the other hand involves monitoring of a specific benchmark index without actually getting involved in buying or selling of stocks. The investors of passive market, seeks to imitate the performance of the index chosen only by maintaining a diverse portfolio of assets that closely resembles the composition of index.
The key benefit of passive management is its simplicity and consistency. By minimizing the need of active decision making, the techniques or strategies of passive market provides investors with a low-cost option to gain an exposure to patterns of long term market.
Both the types of management have their advantages and disadvantages, but the choice between the two highly depends upon the preferences, risk tolerance and investment objectives of the different investors
In the present case, passive management strategy has been adopted and holding has been done till completion of trading timeframe. As stocks have been selected based on fundamentals, passive strategy is considered optimal.
Portfolio Performance Month Wise
| Portfolio Month 1 | |||||||
| Sl NO | Particular | Initial Value | Closing Value | Portfolio Value Opening | Portfolio Value Closing | % Change | Index Change |
| 1 | DBS Group Holdings Ltd | 32.532314 | 32.060001 | 19950 | 19660.360 | -1.45% | 2.01% |
| 2 | Oversea-Chinese Banking Corporation Ltd | 12.71 | 12.82 | 19950 | 20122.659 | 0.87% | 2.01% |
| 3 | United Overseas Bank Ltd | 27.620001 | 27.389999 | 19950 | 19783.869 | -0.83% | 2.01% |
| 4 | Singapore Exchange Ltd | 9.279121 | 9.551416 | 19950 | 20535.431 | 2.93% | 2.01% |
| 5 | Wilmar International Ltd | 3.4 | 3.69 | 19950 | 21651.618 | 8.53% | 2.01% |
| 6 | Singapore Airlines Ltd | 5.857321 | 6.221558 | 19950 | 21190.589 | 6.22% | 2.01% |
| 7 | Keppel Ltd | 6.132505 | 6.48 | 19950 | 21080.456 | 5.67% | 2.01% |
| 8 | Singapore Technologies Engineering Ltd | 3.71124 | 3.79 | 19950 | 20373.379 | 2.12% | 2.01% |
| 9 | Sembcorp Industries Ltd | 4.58 | 5.09 | 19950 | 22171.507 | 11.14% | 2.01% |
| 10 | Seatrium Limited | 0.112 | 0.11 | 19950 | 19593.750 | -1.79% | 2.01% |
| 11 | AstraZeneca PLC | 9944.0313 | 10034.61035 | 19950 | 20131.722 | 0.91% | 1.45% |
| 12 | GSK plc | 1433.7551 | 1403.746582 | 19950 | 19532.446 | -2.09% | 1.45% |
| 13 | Shell PLC | 2674.1255 | 2584.855957 | 19950 | 19284.015 | -3.34% | 1.45% |
| 14 | Unilever PLC | 3914.4089 | 3770.278809 | 19950 | 19215.433 | -3.68% | 1.45% |
| 15 | HSBC Holdings PLC | 573.85999 | 582.234131 | 19950 | 20241.124 | 1.46% | 1.45% |
| 16 | BP PLC | 519.52033 | 470.857208 | 19950 | 18081.297 | -9.37% | 1.45% |
| 17 | Diageo PLC | 3043.408 | 2760.770508 | 19950 | 18097.269 | -9.29% | 1.45% |
| 18 | British American Tobacco plc | 2388.4878 | 2464.072998 | 19950 | 20581.330 | 3.16% | 1.45% |
| 19 | Glencore PLC | 428.75 | 457 | 19950 | 21264.490 | 6.59% | 1.45% |
| 20 | Rio Tinto PLC | 4694.1382 | 5309.880859 | 19950 | 22566.895 | 13.12% | 1.45% |
| Total | 399000 | 405159.64 | 1.54% | 1.73% | |||
Month 02
| Portfolio Month 2 | |||||||
| Sl NO | Particular | Initial Value | Closing Value | Portfolio Value Opening | Portfolio Value Closing | % Change | Index Change |
| 1 | DBS Group Holdings Ltd | 32.060001 | 32 | 19660.360 | 19623.566 | -0.19% | -0.62% |
| 2 | Oversea-Chinese Banking Corporation Ltd | 12.82 | 12.66 | 20122.659 | 19871.518 | -1.25% | -0.62% |
| 3 | United Overseas Bank Ltd | 27.389999 | 27.6 | 19783.869 | 19935.553 | 0.77% | -0.62% |
| 4 | Singapore Exchange Ltd | 9.551416 | 9.491967 | 20535.431 | 20407.616 | -0.62% | -0.62% |
| 5 | Wilmar International Ltd | 3.69 | 3.48 | 21651.618 | 20419.412 | -5.69% | -0.62% |
| 6 | Singapore Airlines Ltd | 6.221558 | 6.43 | 21190.589 | 21900.541 | 3.35% | -0.62% |
| 7 | Keppel Ltd | 6.48 | 6.91 | 21080.456 | 22479.313 | 6.64% | -0.62% |
| 8 | Singapore Technologies Engineering Ltd | 3.79 | 3.8 | 20373.379 | 20427.135 | 0.26% | -0.62% |
| 9 | Sembcorp Industries Ltd | 5.09 | 5.11 | 22171.507 | 22258.624 | 0.39% | -0.62% |
| 10 | Seatrium Limited | 0.11 | 0.112 | 19593.750 | 19950.000 | 1.82% | -0.62% |
| 11 | AstraZeneca PLC | 10034.61 | 10318.16309 | 20131.722 | 20700.594 | 2.83% | 2.84% |
| 12 | GSK plc | 1403.7466 | 1436.032471 | 19532.446 | 19981.688 | 2.30% | 2.84% |
| 13 | Shell PLC | 2584.856 | 2529.458984 | 19284.015 | 18870.732 | -2.14% | 2.84% |
| 14 | Unilever PLC | 3770.2788 | 3745.008057 | 19215.433 | 19086.639 | -0.67% | 2.84% |
| 15 | HSBC Holdings PLC | 582.23413 | 590.96814 | 20241.124 | 20544.758 | 1.50% | 2.84% |
| 16 | BP PLC | 470.85721 | 460.680237 | 18081.297 | 17690.493 | -2.16% | 2.84% |
| 17 | Diageo PLC | 2760.7705 | 2810.5896 | 18097.269 | 18423.840 | 1.80% | 2.84% |
| 18 | British American Tobacco plc | 2464.073 | 2284.5 | 20581.330 | 19081.435 | -7.29% | 2.84% |
| 19 | Glencore PLC | 457 | 470.200012 | 21264.490 | 21878.694 | 2.89% | 2.84% |
| 20 | Rio Tinto PLC | 5309.8809 | 5578.638184 | 22566.895 | 23709.109 | 5.06% | 2.84% |
| Total | 405159.6386 | 407241.26 | 0.51% | 1.11% | |||
Month 03
| Portfolio Month 3 | |||||||
| Sl NO | Particular | Initial Value | Closing Value | Portfolio Value Opening | Portfolio Value Closing | % Change | Index Change |
| 1 | DBS Group Holdings Ltd | 32 | 31.9 | 19623.566 | 19562.242 | -0.31% | 1.04% |
| 2 | Oversea-Chinese Banking Corporation Ltd | 12.66 | 12.91 | 19871.518 | 20263.926 | 1.97% | 1.04% |
| 3 | United Overseas Bank Ltd | 27.6 | 27.93 | 19935.553 | 20173.913 | 1.20% | 1.04% |
| 4 | Singapore Exchange Ltd | 9.491967 | 9.591049 | 20407.616 | 20620.641 | 1.04% | 1.04% |
| 5 | Wilmar International Ltd | 3.48 | 3.33 | 20419.412 | 19539.265 | -4.31% | 1.04% |
| 6 | Singapore Airlines Ltd | 6.43 | 6.52 | 21900.541 | 22207.081 | 1.40% | 1.04% |
| 7 | Keppel Ltd | 6.91 | 6.84 | 22479.313 | 22251.592 | -1.01% | 1.04% |
| 8 | Singapore Technologies Engineering Ltd | 3.8 | 3.86 | 20427.135 | 20749.669 | 1.58% | 1.04% |
| 9 | Sembcorp Industries Ltd | 5.11 | 5.36 | 22258.624 | 23347.598 | 4.89% | 1.04% |
| 10 | Seatrium Limited | 0.112 | 0.107 | 19950.000 | 19059.375 | -4.46% | 1.04% |
| 11 | AstraZeneca PLC | 10318.163 | 10426.46387 | 20700.594 | 20917.870 | 1.05% | -2.69% |
| 12 | GSK plc | 1436.0325 | 1540.813354 | 19981.688 | 21439.663 | 7.30% | -2.69% |
| 13 | Shell PLC | 2529.459 | 2336.064697 | 18870.732 | 17427.937 | -7.65% | -2.69% |
| 14 | Unilever PLC | 3745.0081 | 3660.772705 | 19086.639 | 18657.329 | -2.25% | -2.69% |
| 15 | HSBC Holdings PLC | 590.96814 | 566.949707 | 20544.758 | 19709.767 | -4.06% | -2.69% |
| 16 | BP PLC | 460.68024 | 440.721558 | 17690.493 | 16924.064 | -4.33% | -2.69% |
| 17 | Diageo PLC | 2810.5896 | 2678.889648 | 18423.840 | 17560.527 | -4.69% | -2.69% |
| 18 | British American Tobacco plc | 2284.5 | 2334.5 | 19081.435 | 19499.063 | 2.19% | -2.69% |
| 19 | Glencore PLC | 470.20001 | 397.899994 | 21878.694 | 18514.530 | -15.38% | -2.69% |
| 20 | Rio Tinto PLC | 5578.6382 | 5075.677734 | 23709.109 | 21571.536 | -9.02% | -2.69% |
| Total | 407241.2624 | 399997.59 | -1.78% | -0.82% | |||
Month 04
| Portfolio Month 4 | |||||||
| Sl NO | Particular | Initial Value | Closing Value | Portfolio Value Opening | Portfolio Value Closing | % Change | Index Change |
| 1 | DBS Group Holdings Ltd | 31.9 | 32.459999 | 19562.242 | 19905.654 | 1.76% | -4.44% |
| 2 | Oversea-Chinese Banking Corporation Ltd | 12.91 | 12.98 | 20263.926 | 20373.800 | 0.54% | -4.44% |
| 3 | United Overseas Bank Ltd | 27.93 | 28.219999 | 20173.913 | 20383.380 | 1.04% | -4.44% |
| 4 | Singapore Exchange Ltd | 9.591049 | 9.165 | 20620.641 | 19704.641 | -4.44% | -4.44% |
| 5 | Wilmar International Ltd | 3.33 | 3.26 | 19539.265 | 19128.529 | -2.10% | -4.44% |
| 6 | Singapore Airlines Ltd | 6.52 | 6.79 | 22207.081 | 23126.699 | 4.14% | -4.44% |
| 7 | Keppel Ltd | 6.84 | 7.11 | 22251.592 | 23129.944 | 3.95% | -4.44% |
| 8 | Singapore Technologies Engineering Ltd | 3.86 | 3.76 | 20749.669 | 20212.112 | -2.59% | -4.44% |
| 9 | Sembcorp Industries Ltd | 5.36 | 5.52 | 23347.598 | 24044.541 | 2.99% | -4.44% |
| 10 | Seatrium Limited | 0.107 | 0.09 | 19059.375 | 16031.250 | -15.89% | -4.44% |
| 11 | AstraZeneca PLC | 10426.464 | 9671.308594 | 20917.870 | 19402.856 | -7.24% | 1.44% |
| 12 | GSK plc | 1540.8134 | 1635.096313 | 21439.663 | 22751.564 | 6.12% | 1.44% |
| 13 | Shell PLC | 2336.0647 | 2451.804688 | 17427.937 | 18291.402 | 4.95% | 1.44% |
| 14 | Unilever PLC | 3660.7727 | 3988.299805 | 18657.329 | 20326.589 | 8.95% | 1.44% |
| 15 | HSBC Holdings PLC | 566.94971 | 586.411316 | 19709.767 | 20386.342 | 3.43% | 1.44% |
| 16 | BP PLC | 440.72156 | 470.560791 | 16924.064 | 18069.914 | 6.77% | 1.44% |
| 17 | Diageo PLC | 2678.8896 | 2886.551514 | 17560.527 | 18921.782 | 7.75% | 1.44% |
| 18 | British American Tobacco plc | 2334.5 | 2484 | 19499.063 | 20747.772 | 6.40% | 1.44% |
| 19 | Glencore PLC | 397.89999 | 396.799988 | 18514.530 | 18463.346 | -0.28% | 1.44% |
| 20 | Rio Tinto PLC | 5075.6777 | 5146.706543 | 21571.536 | 21873.407 | 1.40% | 1.44% |
| Total | 399997.5888 | 405275.53 | 1.32% | -1.50% | |||
Overall Performance
| Overall | |||||||
| Sl NO | Particular | Initial Value | Closing Value | Portfolio Value Opening | Portfolio Value Closing | % Change | Index Change |
| 1 | DBS Group Holdings Ltd | 32.532314 | 32.459999 | 19950.000 | 19905.654 | -0.22% | -2.12% |
| 2 | Oversea-Chinese Banking Corporation Ltd | 12.71 | 12.98 | 19950.000 | 20373.800 | 2.12% | -2.12% |
| 3 | United Overseas Bank Ltd | 27.620001 | 28.219999 | 19950.000 | 20383.380 | 2.17% | -2.12% |
| 4 | Singapore Exchange Ltd | 9.279121 | 9.165 | 19950.000 | 19704.641 | -1.23% | -2.12% |
| 5 | Wilmar International Ltd | 3.4 | 3.26 | 19950.000 | 19128.529 | -4.12% | -2.12% |
| 6 | Singapore Airlines Ltd | 5.857321 | 6.79 | 19950.000 | 23126.699 | 15.92% | -2.12% |
| 7 | Keppel Ltd | 6.132505 | 7.11 | 19950.000 | 23129.944 | 15.94% | -2.12% |
| 8 | Singapore Technologies Engineering Ltd | 3.71124 | 3.76 | 19950.000 | 20212.112 | 1.31% | -2.12% |
| 9 | Sembcorp Industries Ltd | 4.58 | 5.52 | 19950.000 | 24044.541 | 20.52% | -2.12% |
| 10 | Seatrium Limited | 0.112 | 0.09 | 19950.000 | 16031.250 | -19.64% | -2.12% |
| 11 | AstraZeneca PLC | 9944.0313 | 9671.308594 | 19950.000 | 19402.856 | -2.74% | 2.99% |
| 12 | GSK plc | 1433.7551 | 1635.096313 | 19950.000 | 22751.564 | 14.04% | 2.99% |
| 13 | Shell PLC | 2674.1255 | 2451.804688 | 19950.000 | 18291.402 | -8.31% | 2.99% |
| 14 | Unilever PLC | 3914.4089 | 3988.299805 | 19950.000 | 20326.589 | 1.89% | 2.99% |
| 15 | HSBC Holdings PLC | 573.85999 | 586.411316 | 19950.000 | 20386.342 | 2.19% | 2.99% |
| 16 | BP PLC | 519.52033 | 470.560791 | 19950.000 | 18069.914 | -9.42% | 2.99% |
| 17 | Diageo PLC | 3043.408 | 2886.551514 | 19950.000 | 18921.782 | -5.15% | 2.99% |
| 18 | British American Tobacco plc | 2388.4878 | 2484 | 19950.000 | 20747.772 | 4.00% | 2.99% |
| 19 | Glencore PLC | 428.75 | 396.799988 | 19950.000 | 18463.346 | -7.45% | 2.99% |
| 20 | Rio Tinto PLC | 4694.1382 | 5146.706543 | 19950.000 | 21873.407 | 9.64% | 2.99% |
| Total | 399000 | 405275.53 | 1.57% | 0.44% | |||
Based on above computation, it may be inferred that portfolio has outperformed the benchmark. Thus, the objective of short term outperformance has been achieved.
Efficient Market Hypothesis
Efficient Market Hypothesis (EMH), developed by Eugene Fama in 1960s, is a fundamental theory in financial economics which claims that the prices of the assets represents all the information available, thus making it hard for investors to continuously beat the market.
EMH indicates three forms of market efficiency which involves:
Weak form of efficiency – Under this form of market efficiency, prices of securities already includes all the data relating to trading, historical prices and its volumes. As a result, this technical evaluation which involves depending on the previous price patterns, proves to be inefficient for frequently beating the market.
Semi-Strong form of efficiency – Under this form of market efficiency, the asset price involves information which are available publicly, such as financial statements, economic data and news related to the company. As a result of this fundamental evaluation, intrinsic value of the shares calculated proves to yield inconsistent returns.
Strong form of efficiency – Under this form of market efficiency, the value of the assets involves both public and private information. Even though the price depicts the insider knowledge of the company, it does not provide any benefit to the investors looking to beat the market.
This approach is beneficial to investors only in providing suggestions relating to active trading strategies such as stock pricing, market timing, etc. but are unlikely to continuously exceeds the passive investment strategies in the long term period.
However, in the present case diversified portfolio has outperformed the market which is a deviation to Efficient Market Hypothesis in all the forms.
Conclusion
On the basis of above discussion, it may be inferred that market is not efficient and one can outperform the benchmark through selection of stocks and finding stocks which are undervalued in the short term. Based on above computation, one may infer that portfolio has generated a return of 1.57% over the period while index has generated a return of 0.44%
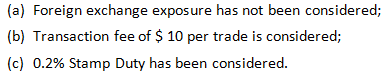
Assumptions