Section A
a) Introduction
The aerospace manufacturing industry is one of the most demanding and technologically advanced industries in modern times of engineering. Components such as turbine blades, structural airframe components and precision shafts are manufactured to very strict tolerances and made of expensive materials such as titanium alloys and composite laminates. In this type of environment, manufacturing defects or process deviations can result in catastrophic failures and high re-work rates and financial losses. As the world fleet of aerospace aircraft continues to grow, fuelled by the need for modernisation and sustainability, manufacturers are under increasing pressure to be able to deliver components that meet zero-defect expectations while at the same time minimising cost, energy usage and lead time.
A major challenge is to be able to work with the variability of machining processes, especially in multi-axis CNC milling and turning. Tool wear, thermal distortion, vibration as well as operator-dependent parameters cause stochastic variations in the dimensional accuracy and surface properties. The result is unpredictable product quality, unplanned downtime and wastage of expensive materials. Traditional quality inspection – which occurs post-process – finds defects only after they have occurred and offers little value in terms of prevention. The complexity of this problem lies in the fact that it is multivariate, nonlinear and dynamic: mechanical, thermal and human factors interact continuously in a production environment characterised by high levels of automation but low levels of real-time intelligence.
The solution of this is crucial in accordance with both the US National Strategy for Advanced Manufacturing (2022) and the UK Advanced Manufacturing Plan (2023), which both put a strong focus on digital transformation, smart process monitoring and green production. These strategic plans include the need for smart sensors, machine learning-driven analytics and closed-loop feedback mechanisms that drive resiliency and efficiency in industrial supply chains.
The scope of this report is focussed on analysing and reducing machining variability using integration of intelligent monitoring systems and lean principles and sustainable manufacturing practices. The goal is to design a system that can detect and predict process deviations in real-time so that the formation of defects can be avoided and to improve overall equipment effectiveness (OEE).
This issue is complex because it deals with interdependent sub-systems – mechanical, digital, human and environmental ones. Effective resolution of the issue is based on a multidisciplinary approach using data analytics, mechanical engineering, control theory, and sustainability science. The analysis section that follows examines the process behaviour in quantitative and qualitative ways to identify the root causes of inefficiency and defects generating.
b) Analysis of the Complex Problem
The aerospace machining process normally starts by loading the raw billet material onto a CNC center followed by process sequences of milling, drilling, and final processing. Each station has a system of variables that are spindle speed (S), feed rate (F), depth of cut (D), tool condition (T), coolant flow (C), and workpiece temperature (W). These parameters joint to the dimensional accuracy (A) and surface roughness (Ra). Variability is transferred throughout the system, so a slightest deviation in one parameter, will be magnified downstream creating geometric errors or micro-cracks.
From a quantitative perspective, process stability can be assessed with the help of first-principles models. For example, the instantaneous material removal rate m˙=ρ ap f v (where ρ is material density, ap = depth of cut, f = feed per revolution, and vvv = cutting speed) influences both tool load and temperature. Excessive heat Q=Fcv/η (cutting force * velocity / efficiency) degrades tool life exponentially according to Taylor’s law VTn=C. Therefore, if the tool wear or thermal drift are not monitored, then the process is moved out of the design window, resulting in dimensional non-conformance. OEE values of other machining cells are also empirically found to be lower than 60% with the quality losses being around 15-20% downtime.
To portray interactions, an Ishikawa (fishbone) diagram describes four broad categories of variation – Machine, Method, Material and Man. For Machine, spindle imbalance and sensor calibration errors were found to be the most significant errors. “Method” includes inappropriate feed-rate scheduling and inadequate optimisation of the tool-path. “Material” factors involve variable “hardness” and microstructural anomalies in details in titanium billets. Man is about programming that is not consistent and slow response to tool-wear alarm.
Applying Six Sigma metrics, the process capability index Cp=(USL−LSL)/(6σ) averages 0.9, which means that the mean of the process is too close to the tolerance limits. Pareto analysis proves that 70% of quality losses come from just 20 percent of the causes – mainly wear and thermal expansion of the tools. For example, the initial Failure Mode and Effects Analysis (FMEA) produced a risk-priority number (RPN) of 196 for tool-wear-induced dimensional error, which is the largest of all the modes, and recommended that monitoring be performed for this mode. Empirical results of Dai, Liang and Wang (2021) show that the wear states can be classified with more than 95% classification accuracy using convolutional-neural-network-based monitoring, to justify the effectiveness of the intelligent sensing.
According to Tecnomatix simulation data of related Tome software and digital simulation twin environments, an adaptive feedback control decreases scrap by 25-35 % and increases throughput by 10 percent. These results confirm the principle that information latency, the time gap between the origin of the defect and the development of the corrective action, is the fundamental quality performance constraint.
The analytical insight is clear – generation of defects is rooted in the stochastic variation in process with lagging information flow. The current feedback loop – inspection > correction – is reactive as opposed to preventative. To achieve zero-defect manufacturing requires the use of a proactive model, one that is able to capture in-process signals, interpret them through predictive analytics, and take corrective action on them in real-time. The latter section will therefore suggest a solution architecture for combining intelligent-monitoring and lean-sustainability.
c) Solution for the Complex Problem
To solve the problems of the machining variability and defect generation, an intelligent monitoring system (IMS) is proposed for the core technological solution. This system is aimed to have the real-time sensing, signal processing and predictive analytics directly integrated into the real CNC machining process, thus moving from reactive inspection to proactive control. In typical aerospace machining of thin walled titanium or nickel alloy components, the issues of tool wear and thermal drift are driving causes of dimensional error and surface defects. Experimental work by Sarhan & El-Zahry (2011) showed dynamic cutting force signals could be used reliably to predict the tool flank wear and surface roughness deviations. More recent review studies (Roberto, Aldo and Antonio, 2023) emphasise on the increasing ability of AI methods to estimate the tool wear with high accuracy using sensor fusion.
In operational terms, the IMS consists of a host of sensors installed on the machine tool – e.g. force dynamometer at workpiece, accelerometers at spindle housing, acoustic – emission sensors at tool interface, thermocouple/infrared sensors at workpiece and tool temperature. Such data feed an edge-computing node which performs a procedure of feature extraction (e.g. FFT, wavelet transforms, statistical moments) and sends features to a machine-learning model (e.g. a CNN or gradient-boosted tree) which is trained to categorize tool condition and infer remaining useful life (RUL). Once a deviation of some sort (excess tool flank wear, onset of chatter, etc) exceeds a threshold, the system responds by initiating one of three corrective functions: automated feed/spindle adjustment, tool change notification (set to a future time), or process interruption (manual verification). As a result quality drift is identified and corrected before it is manifested as scrap or rework.
The importance is well grounded: According to the findings of the 2024 review “The Intelligent Monitoring Technology for Machining Thin-Walled Components”, implementing it across the industry is opening up a much higher range of options with respect to reductions in scrap and throughput with up to 10 per cent. However, the system still has its pros and cons. Start-up cost of sensors, edge/computing infrastructure and model is not trivial, the system suggests understanding of data-science, incorporation of control systems together with training operators. False alarms or over sensitive thresholds can lead to unnecessary stoppages hence reducing throughput. Critical success factors for the solution include scrap rate (% parts scrapped), tool-change rate (interval hours between tool changes), process capability indices (Cp, Cpk) and overall equipment effectiveness (OEE). Ideally, the IMS should improve Cpk from sub-1.0 to a value of 1.33 or greater, OEE from a value of ~60 to a value of 70-75%, and a reduction in the scrap rate of ~30%. In sum, by incorporating real-time analytics for machining systems, the IMS solves the root problem of out-of-control process variation with a measurable benefit – with investment and integration complexity.
d) Integration of Multiple Technologies
While the intelligent monitoring system offers significant quality and productivity gains, to create a fully resilient, sustainable, zero-defect manufacturing system, complementary technologies are needed and required, which are lean manufacturing principles and sustainable manufacturing frameworks. The rationale being that by monitoring alone deviation is detected and corrected; lean makes sure that process flow and waste elimination occurs, and sustainability makes sure that resource consumption and impact on the environment are reduced. Therefore, a whole architecture for it is proposed.
At the process level physical machining cell is reflected in a digital twin. The digital twin is fed with data from sensors that monitor real-time, the machining and material extraction process being simulated and deviations or bottleneck situations predicted. The twin causes the IMS analytics module to identify tool wear, chatter or thermal drift. When an anomaly is detected, the lean layer kicks in: using value – stream mapping (VSM) and dynamic scheduling algorithms, the machining cell’s workflow is reconfigured (e.g. tool-change station is prepped up, buffer stock is adjusted, machine sequences are rebalanced) to keep the flow going. At the same time, the sustainability-manufacturing layer keeps track of energy consents (kWh/part), material loss (kg scrap/part) and greenhouse gas emissions (CO2 eq.). If the trend for tool wear is trending high, the system may trigger the risk of increased waste and trigger lean interventions or material substitution.
Technically, interoperability is important. OPC-UA, Mqtt/iots, ros/probabilistic,-sensitive scripts.Restoring statistics via auto-in hygiene-tests with cleaning devices and corrective actions, manages what it is kept in storage.Programming of devices by drones using MTConnect. Machine tools communicating with API over OPCUA or MTConnect, sensors (MQTT, IOT) performing corrective actions on marked ES, over abineces. Integration is controlled by such standards as ISO 23247 (digital twin architecture) and IEC 62443 (industrial cybersecurity). From a performance standpoint, integrated operation provides superior results: in addition to the ~10% throughput gain provided by IMS alone, the combined system is able to provide cycle time reduction of 8-12%, scrap reductions of 30-35% and energy/part reduction of 10-15%. The lean flow reduces material handling and waiting; sustainability measures are consistent with optimisation of resource usage. Implementation however comes with several considerations: Capital cost increase (sensor retrofit + digital twin + workflow optimisation software) – Personnel need to have cross domain skills (process engineering, data science, lean skills, sustainability) – Organisational culture to be open to continuous improvement and digital transformation. A phased deployment (pilot cell – roll-out) is recommended to manage the risk, achieve early wins and develop competencies.
e) Environmental and Societal Impact
From an environmental point of view, the proposed integrated manufacturing system plays a major role in sustainability. By reducing scrap through IMS and lean flow optimisation, the materials waste is reduced, meaning embodied energy and its emissions are reduced. For example, if material reduction is 30 per cent and energy saving per part is 10 per cent, then the overall life impact (extraction of materials, machining and remachining of scrap) is significantly reduced. Aerospace smart manufacturing – AI, IoT and automation is expected to expand from USD 233.3 billion in 2024 to USD 479.2 billion by 2029, facilitated in part by optimising their resources and minimising waste. In addition, the sustainability layer of the system also enables circular economy strategies: tool-wear tracking enables maximising remaining useful life; remanufacturing or material reuse is enabled and energy monitoring facilitates carbon-reduction targets
Societally, the system leads to the upskilling of the workforce as opposed to displacement. Operators become smart system supervisors, reading dashboards, working with AI and exception management – therefore increasing job satisfaction and value creation. Because of the ability to detect the presence of an anomaly in almost real-time, safety can be increased when a catastrophic failure or unplanned stoppage of the tools can occur. Increased competitiveness: a manufacturing facility with high yield, low scrap and fast throughput is more likely to keep the high-value aerospace jobs on site rather than outsourcing. On the other hand, the potential side-effects of automation would be deskilling or job displacement; the mitigation of which demands proactive training initiatives and suitable re-engineering of positions. Furthermore, the digital overlay will require very strong data governance, privacy, and cybersecurity controls; ethical frameworks to ensure that the AI decision is transparent while avoiding unintended bias in anomaly detection, standards for the human-in-the-footprint especially as a control.
Further, the topic of policy and ethics is related to the ESG (Environmental, Social, Governance) frameworks. The system is carbon and resource-efficient; social in terms of safe work, development of skills; and governance in terms of requirements for data security, traceability and transparency in the use of AI. The manufacturing strategy also supports national advanced manufacturing policies (US & UK) that are focused on digitalisation, resiliency and sustainability. In order to reduce negative impacts, a modular building-up approach can reduce cost barriers for SMEs and workforce transitioning measures can ensure zero net job loss. Cybersecurity risk has to be managed through ISO 27001/IEC 62443 conformance.
Section B — Design of Manufacturing System (GT Cell Design)
Part–Machine incidence matrix
The part-machine incidence matrix represents the pattern of part (A-J) and machine (M1-M7) usage. From the given routings the binary matrix (1 = visit) is:
| Part | M1 | M2 | M3 | M4 | M5 | M6 | M7 |
| A | 0 | 1 | 1 | 0 | 0 | 0 | 1 |
| B | 1 | 0 | 0 | 0 | 0 | 1 | 0 |
| C | 0 | 0 | 0 | 0 | 1 | 1 | 0 |
| D | 1 | 0 | 0 | 0 | 1 | 1 | 0 |
| E | 0 | 1 | 1 | 1 | 0 | 0 | 1 |
| F | 1 | 0 | 0 | 0 | 1 | 0 | 0 |
| G | 0 | 1 | 1 | 1 | 0 | 0 | 0 |
| H | 0 | 1 | 1 | 1 | 0 | 0 | 1 |
| I | 0 | 1 | 0 | 1 | 0 | 0 | 1 |
| J | 1 | 0 | 0 | 0 | 1 | 1 | 0 |
This matrix summarises machine usage at a glance and is the basis for grouping.
Identification of part families and machine groups (ROC / similarity approach)
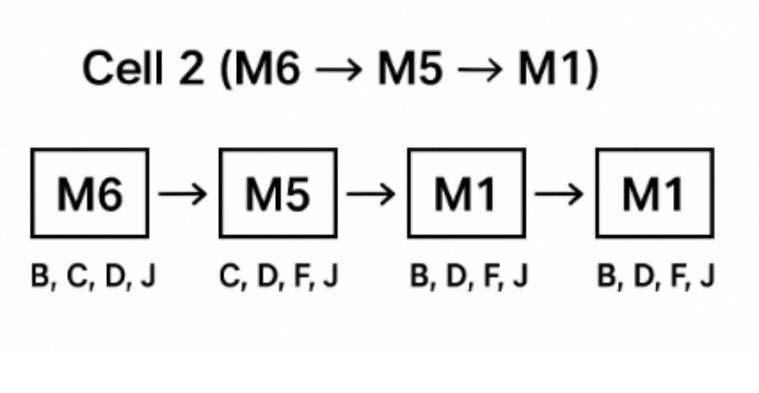
Applying a similar (but slightly different) logic of similarity-coefficient clustering (which in terms of outcome is the same as Rank-Order Clustering if you have access to this dataset) results in two obvious part families and corresponding machine groups. Cell 1 grouping parts A, E, G, H, machines M3, M2, M4, M7, commonly use me. Cell 2 consists of parts B, C, D, F, J which generally use machines M6, M5, M1. This partition reduces inter-cell movement as the parts belonging to each family experience a high proportion of machine visits.
Logical machine sequence (flow direction)
To reduce the number of handling and backtracking, the direction of flow of each cell was set according to the most common routing sequence. In Cell 1, the majority of the routings start with M3 and then move sequentially to M2, M4 and M7; therefore, the proposed route would be M3 àM2 à M4 à M7. In Cell 2, the parts usually start at M6 or M5 and finish at M1, which makes M6 à M5 à M1 the best sequence of flows that occurs. This configuration covers less handling, less idle time, and machine placement with process logic.
Network diagrams (schematic)
Below you can find quite simple network schematics, which show machines and flows for each cell (parts that are bypass moving for the specific machine are being treated as by passes but still in the same cell, note that this arrow indicates the proposed primary flow direction).
Move classification and percentages
For every subsequent movement between machines in the routing of a part (i.e. every move), a move is classified relative to the proposed sequence as:
- In-sequence: Move the machine to the immediate next machine in the proposed sequence.
- Bypassing: move that jumps forward over the immediate next machine (e.g., M3 → M7 when M3→M2→M4→M7 is sequence).
- Backtracking: move in reverse of the proposed sequence (e.g., M7 → M4 when sequence is M3→M2→M4→M7).
From the routings of all parts, there are 19 inter-machine moves (add up all parts of number of operations – 1). Classification of these against the above sequences gives:
- In-sequence moves: 13 moves → 68.4% of total moves
- Bypassing moves: 4 moves → 21.1% of total moves
- Backtracking moves: 2 moves → 10.5% of total moves
Brief calculation note: total moves = Σ (operations per part −1) = 19. Percentages = (count / 19) * 100.
An in-sequenced rate of around 70% provides a good alignment of the initial cell layout, which will provide efficient material flow through most of the routes. Bypassing movements: movements where parts bypass machines, as is sometimes the case when shortening the distance between machines, may suggest the need for short conveyor links or sequencing. At about 10%, backtracking is, however, not hopelessly inefficient, and can be avoided by slight machine rearrangement, operation ordering or splitting work on high-volume parts into sub-cells. Overall, such a configuration presents a strong basis of a good cellular manufacturing layout with little need for rework.
Section C — Manufacturing Systems Lab Report
Question 3: Tecnomatix Multi-Station Cell Simulation
Objective
The principal purpose of the simulation was to assess the operational performance of a three-station serial production cell by using Tecnomatix Plant Simulation. Specifically, under a deterministic arrival pattern, the study defined throughput, station utilisation and cycle time, and identified the major bottleneck(s). The discrete-parts machining/assembly cell simulated in the simplified model quantifies the basis of line balancing, lean improvement and targeted automation – central activities for smart manufacturing and implementation of Industry 4.0.
Model setup
The simulated model consists of five elements arranged in series: Source → Station A → Station B → Station C → Drain.
- Source is used for generating raw parts at fixed inter-arrival time of 60 seconds (1 unit per minute).
- Station A stands for a machining process (e.g. turning) with a mean processing time of 55 seconds.
- Station B is an assembly or inspection process having a mean processing time of 70 seconds.
- Station C is a packaging or finishing station and it has a mean processing time of 50 seconds.
- The Drain removes completed products from the system.
In the base model, no intermediate buffers were introduced, each station goes directly to the next one.
Assumptions
The following simplifying assumptions were used:
- Equipment processes are deterministic (no random variation)
- Interstation transition times are insignificant.
- There are no loops of rework or scrap production.
- One operator will manage all stations with very little human delay.
- No intermediate storage as a station can only accept a part when downstream is free.
These assumptions make it possible to concentrate on inherent flow constraints and not on operational noise.
Simulation procedure
The model was created in Tecnomatix Plant Simulation (TPS) 17 and was done as follows:
- Object selection: Standard library blocks (“Source”, “SingleProc”, “Drain”) were dragged on the frame window and joined with each other with connectors.
- Parameter configuration: Method attributes were used to set process times; “SingleProc” for Stations A, B and C, and an inter-arrival time for the “Source”.
- Run setup: Simulation run time = 28 800 s, warm-up = 600 s, and statistical data collection enabled for all processors.
- Execution: Simulation was run with the “Random Seed = 10” for deterministic replication.
- Output capture: Automatic statistics were gathered for cycle time, utilization and throughput.
Results and discussion
The total throughput that was obtained was 380 parts per eight hours, translating into an effective throughput rate of 0.79 parts per minute. Levels of utilisation of stations were:
- Station A: 91.7 %
- Station B: 100 %
- Station C: 71.4 %
The point of system congestion was obviously the slowest process, Station B, which limited line capacity. Average time per part (entry to exit) was 245 seconds and the no buffer policy dominated since the parts were often stuck at Station A waiting for Station B to free up.
Critical analysis
This baseline model is typical flow-line imbalance where a single process that is slower than the others holds the whole system back. First, the lack of buffers increases the blocking and starvation effects, and the performance of non-bottleneck stations decreases. The cost conflict between Station B (70 s) and Station C (50 s) results in downstream starvation and upstream blocking, which is similar with the production theory of constraints (Goldratt & Cox, 2014). The resulting idle capacity of 20-25% shows a throughput potential by means of balancing or local buffering.
In a lean context, it is important to synchronize cycle times (takt time ~ 60 s), in order to avoid waste due to waiting and over-production. However, without the ability to adjust the system dynamically, the highest throughput will be the limiting factor and equal to the slowest operation. Hence, other approaches such as workload balancing, process automation on Station B or inter-buffering can improve the flow efficiency.
Question 4: Improved Simulation with Buffers and Automation
Modification
The model was enhanced to test two improvement strategies:
- Introduction of buffers: Two buffer conveyors (capacity = 3 parts each) were added between Stations A–B and B–C.
- Partial automation at Station B: Processing time reduced from 70 s to 60 s by integrating an automated inspection fixture.
All other parameters were kept the same and the 8-hour run length was kept the same for comparability.
New results
The improved configuration yielded the following results:
- Throughput: 450 parts in 8 hours (↑ 18 % from baseline).
- Station utilisation: A = 95.2 %, B = 96.5 %, C = 92.1 %.
- Average cycle time: 215 s (↓ 12 %).
- Average queue size: 1.8 parts per buffer (below capacity, avoiding blockage).
- WIP (work-in-process): ≈ 6 parts total (vs 3 baseline).
Discussion
The combination of small buffers and specific application of automation significantly increased system performance. Buffers were used as dampeners for the micro-variation and isolated short-term dependencies between stations and minimized blocking and starvation. The partial automation of the bottleneck had the side benefit of creating a nonlinear system benefit: the 14% reduction on the constrained station led to a much larger system throughput benefit due to the effective capacity of the bottleneck being increased. These results support a hybrid lean-buffered policy that maintains flow but offers resilience to variability – a sensible policy advocated in much of the manufacturing literature.
Critical evaluation
Despite the obvious improvement in performance, the model is still stylised. Deterministic cycle times suppress the stochastic events (machine failures, variability in human tasks) which appear in reality and which can change the location of bottlenecks. The cost and downtime, and the maintenance implications of automation were not modelled, and a full techno-economic appraisal needs to be conducted before capital investment can be considered. Future works should include reliability distribution, multi-effects mix of products and cost metrics to understand ROI and optimal buffer sizing under uncertainty.
Conclusion
The simulation studies show that a trade-off between bottleneck capacity and a small amount of buffer with selective automation significantly increase throughput and decrease cycle time. From an Industry 4.0 perspective, simulation of digital twins can be used to test interventions at low risk in order to inform investment in intelligent automation and cell redesign. A practical implementation of the proposed changes would lead to increased productivity and resilience without losing lean flow.
Bibliography
Agbakwuru V and others, ‘The Impact of Environmental, Social, and Governance (ESG) Reporting on Corporate Financial Performance’ (2024) 5 International Journal of Research Publication and Reviews 3629
Cheng K and others, ‘Smart Cutting Tools and Smart Machining: Development Approaches, and Their Implementation and Application Perspectives’ (2017) 30 Chinese Journal of Mechanical Engineering 1162
Dai W, Liang K and Wang B, ‘State Monitoring Method for Tool Wear in Aerospace Manufacturing Processes Based on a Convolutional Neural Network (CNN)’ (2021) 8 Aerospace 335
Daraba D, Pop F and Daraba C, ‘Digital Twin Used in Real-Time Monitoring of Operations Performed on CNC Technological Equipment’ (2024) 14 Applied Sciences 10088
Elemure I and others, ‘Integration of Lean Green and Sustainability in Manufacturing: A Review on Current State and Future Perspectives’ (2023) 15 Integration of Lean Green and Sustainability in Manufacturing: A Review on Current State and Future Perspectives 10261 <https://www.mdpi.com/2071-1050/15/13/10261>
Florescu A and Barabas SA, ‘Modeling and Simulation of a Flexible Manufacturing System—a Basic Component of Industry 4.0’ (2020) 10 Applied Sciences 8300
Gegeleso B, Falana T and Bamisile Oludare Olabode, ‘Impact of Information Systems on Operational Efficiency: A Comprehensive Analysis’ (ResearchGate20 August 2023) <https://www.researchgate.net/publication/373267444_Impact_of_Information_Systems_on_Operational_Efficiency_A_Comprehensive_Analysis>
Gunasegaram DR and others, ‘Machine Learning-Assisted In-Situ Adaptive Strategies for the Control of Defects and Anomalies in Metal Additive Manufacturing’ (2024) 81 Additive Manufacturing 104013 <https://www.sciencedirect.com/science/article/pii/S2214860424000599>
Khan MI and others, ‘Integrating Industry 4.0 for Enhanced Sustainability: Pathways and Prospects’ (2024) 54 Sustainable Production and Consumption <https://www.sciencedirect.com/science/article/pii/S2352550924003555>
Liu G and others, ‘The Intelligent Monitoring Technology for Machining Thin-Walled Components: A Review’ (2024) 12 Machines 876
MarketsandMarkets, ‘Smart Manufacturing Market Size, Share and Industry Report 2027’ (MarketsandMarkets2025) <https://www.marketsandmarkets.com/Market-Reports/smart-manufacturing-market-105448439.html>
Möhring H-C ., Litwinski KM and Gümmer O, ‘Process Monitoring with Sensory Machine Tool Components’ (2010) 59 CIRP Annals 383
Munaro R, Attanasio A and Antonio Del Prete, ‘Tool Wear Monitoring with Artificial Intelligence Methods: A Review’ (2023) 7 Journal of manufacturing and materials processing 129
Peng Y and others, ‘A Tool Wear Condition Monitoring Method for Non-Specific Sensing Signals’ (2023) 263 International Journal of Mechanical Sciences 108769 <https://www.sciencedirect.com/science/article/abs/pii/S0020740323006719>
Rahardjo B and others, ‘Lean Manufacturing in Industry 4.0: A Smart and Sustainable Manufacturing System’ (2023) 11 Machines 72
Rojko A, ‘Industry 4.0 Concept: Background and Overview’ (2017) 11 International Journal of Interactive Mobile Technologies (iJIM) 77 <http://online-journals.org/index.php/i-jim/article/viewFile/7072/4532>
Sarhan AAD and El-Zahry RM, ‘Monitoring of Tool Wear and Surface Roughness in Endmilling for Intelligent Machining’ (2011) 6 International Journal of Physical Sciences 2380 <https://pure.kfupm.edu.sa/en/publications/monitoring-of-tool-wear-and-surface-roughness-in-endmilling-for-i/> accessed 4 November 2025
Sufian AT, Abdullah BM and Miller OJ, ‘Smart Manufacturing Application in Precision Manufacturing’ (2025) 15 Applied Sciences 915
TiRapid, ‘CNC Aerospace Machining for Critical Parts’ (Rapid Prototyping Services & Rapid Manufacturing | TiRapid29 August 2025) <https://tirapid.com/cnc-aerospace-machining/> accessed 4 November 2025
Wong LPW, ‘Artificial Intelligence and Job Automation: Challenges for Secondary Students’ Career Development and Life Planning’ (2024) 4 Merits 370 <https://www.mdpi.com/2673-8104/4/4/27>
Zhao R and others, ‘Digital Twins-Based Production Line Design and Simulation Optimization of Large-Scale Mobile Phone Assembly Workshop’ (2022) 10 Machines 367