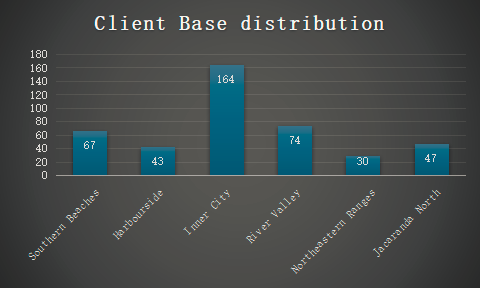
This analysis involved getting how many clients came from each region. I used the UNIQUE function =UNIQUE(Table4[Customer Region]) under the Phase 1 Tab in cell A33 to pull unique regions.
In cell B33, I used the COUNTIF function to count how many members were in each region: =COUNTIF(G: G, A33). Then select A32:B38, Insert under Ribbon, charts, bar chart. It created a bar chart as represented in the Phase- Data analysis,
Part c
I prepared three reports out of which I will give a summary of what they were.
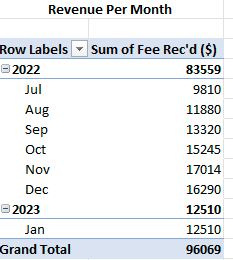
1.Revenue by Month report
This report represented the 7 months’ revenue that the employees earned.
Significance of the report
The report informs us of the highest periods of success and how the revenue growth has been over time
The report is important to help in predicting and planning for better financial outcomes
It is an eye-opener to adjust the marketing for better performance
Areas to upscale
There is a need for an advanced dashboard to monitor the revenues and visitor trend
Manage staff through digital marketing strategies
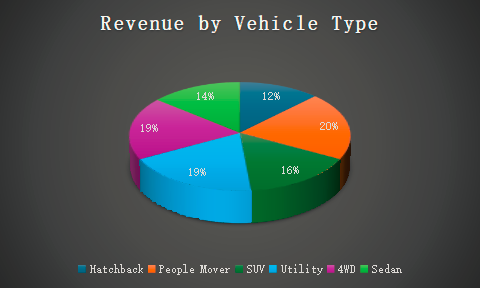
2. Revenue by Vehicle Type
The analysis shows how each type of vehicle contributed to the revenue
Significance of the report
The report points out which vehicle type is the most profitable
It drives the company to strategies on how to do marketing
Improvement areas
Do track which services are offered to which vehicle regularly
Do a ground analysis to understand what clients really need
3. Client Base Distribution Report
It shows how the customers are distributed in different zones
Significance of the report
It shows how the business has spread
The report shows which are the unentered regions
It is a key to know which area needs more allocation of resources to do well
Areas of improvement
Be focused on identifying the areas that need penetration
Run campaigns to understand what each region needs or expects from the company

Phase 2
Part b
Steps to Prepare Employee Productivity Report
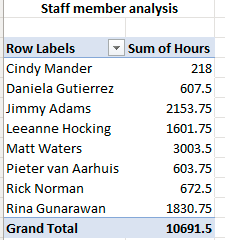
To make this report, the following directions were used. I used the INDEX and MATCH function =INDEX(P:P, MATCH([@[Invoice ‘#]], L: L,0)) under the Phase 2 Tab in cell Y3 to pull the staff members based on the Invoice number and in column Z I converted the minutes that were in column X to hours.
From that data, I created a pivot table that is to represent Employee Productivity based on the hours.

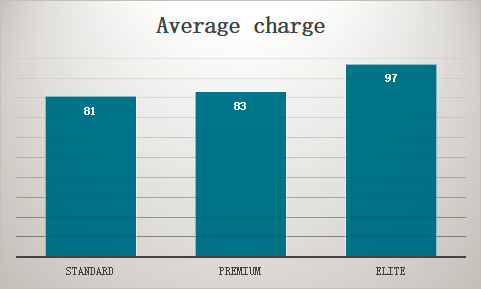
This report is given by dividing the Fee received per service level by the number of hours that service takes. Depending on the figures and the chart, each service was charged correctly based on the service rendered. The difference from one level to the next is not significant, representing fairness and consideration. Because there is no standard or control charge, regular feedback from the client will inform him of the fairness of the charges.
Part c
I prepared three reports out of which I will give a summary of what they were.
1. Email Campaign Report
This report is essential in understanding the amount of revenue that email campaign brings hence crucial for calculating the Return on Investment of digital marketing
Significance of the report
It shows whether the efforts of digital marketing are worthy or not
Give the road map for getting more customers
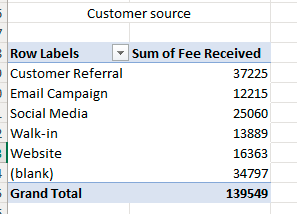
From the pivot chart shot, the firm received some customers from the email campaign. It is hard to do a statistical analysis like ROI because we do not have the email campaign’s initial cost. Therefore , they can compute the ROI as they progress by monitoring the operations.
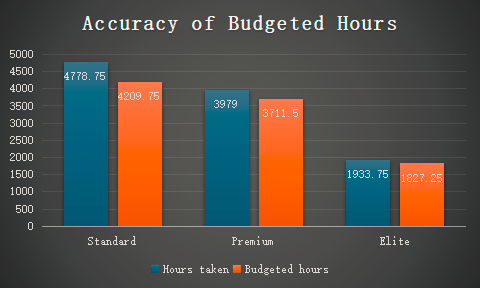
2. Accuracy of Budgeted Hours Report
The report is to show us the variation between the actual service hours and the budget hours
Significance of the report
The time report will inform of the required price level and the benefit earned from it
It shows the importance of time management when delivering services
Improvement areas
Track carefully how the time is spent and forecast in the coming days
Check the discrepancies in service and hours allocated and make adjustment
3. Employee Productivity
It simply shows how many hours each employee worked
Significance of the report
It is crucial to understand the performance of the company and where to adjust
The report shows where the gaps are in mentoring and training sessions
Areas of improvement
Invent employee’s feedback mechanisms to understand their needs
Create channels of communication where important messages can be delivered to the workforce to encourage and motivate them.