Abstract
This report summarizes the findings obtained through a data-driven approach in support of improving productivity and reducing defects in an electronic board manufacturing process. The key types of defects were identified; the trends across the production models analyzed, and the differences between the groups were statistically validated using ANOVA. The following actionable recommendations toward a 20% reduction in defect rate and a 20% increase in production capacity, with maintenance of compliance to the IPC-A-610E criteria, are addressed by the results.
Introduction
The demand of more units from this industry has been challenging in high volume quality maintenance due to defect rates. Some of the major defects identified in the electronic board assembly process include solder bridges, extra/excess solder, missing component, and damaged component. In regard to post-manufacturing correction, costs hugely affect the overall efficiency because of the high costs incurred. Thus, all of the above issues with the help of facts and figures can be solved easily. The analysis compared three production models, Model1, Model2, and Model3, through visual and statistical tools that identified areas for improvement. From this analysis, suggestions of strategic interventions are made that comply with organizational goals and industry standards on best practice.
Methodology
The dataset contained defect count and percentage from production logs across three models. Visualizations were made using Pareto charts, line graphs, stacked bar charts, and pie charts in Tableau to represent defect distribution, trends, and proportionate impact. The statistics included one-way ANOVA to see if defect percentages vary between models. Post-hoc Tukey HSD tests were used to determine specific pairwise differences.
Results
The Tableau dashboard ableau dashboard gives a great overview of defect trends and their distribution across three models.
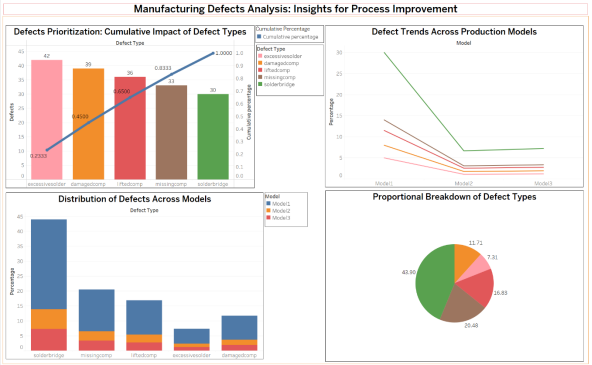
The Pareto chart highlights that the three causes-excessive solder, damaged components, and solder bridges-account for 80% of the total defects. The single highest number of defects is contributed by excessive solder, thus indicating the need to focus these three problems for immediate corrective actions. This corresponds to the principle of focusing a small number of issues which gives the maximum benefit.
The line graph shows a trend of the defect rates across the three models. Model1 has the highest defect percentage, indicating massive inefficiencies in its production processes. Model2 has shown a decreasing trend in defect rates, reflecting recent improvements, whereas Model3 has maintained low defect rates consistently, reflecting effective quality control.
The stacked bar chart compares defect distribution by type and model. Solder bridges dominate in all models, but Model1 has disproportionately higher counts for excessive solder and damaged components. In contrast, Model3 presents a rather balanced and significantly reduced defect distribution and is a model of best practices for process quality.
The pie chart offers a proportional breakdown of defect types, with solder bridges comprising 43.9% of total defects, followed by excessive solder at 20.48% and damaged components at 16.83%. This visualization underscores the necessity of focusing on solder bridges and excessive solder as critical points for defect reduction. Missing and lifted components contribute less significantly but should not be ignored.
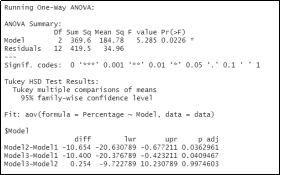
Statistical analysis using one-way ANOVA confirms significant differences in defect percentages across the models (F (2,12) = 5.285, p = 0.0226). Tukey HSD post-hoc tests reveal that Model1 has significantly higher defect percentages compared to both Model2 and Model3, while no significant difference exists between Model2 and Model3.
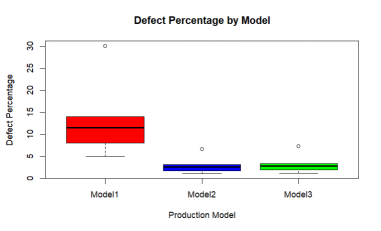
The boxplot visually supports these findings, showing that Model1 has a higher median defect percentage and greater variability, indicating inconsistent processes compared to the stability seen in Model2 and Model3.
Discussion
This analysis pinpoints Model1 to have a much higher defect rate and variability, thus it needs primary attention. The main root causes for this are solder bridges, excessive solder, and damaged components. The efforts of improving these defects will be most effective in enhancing production efficiency and quality. Contrasting this, Model3’s processes are very stable and effective, hence serving as an example for potential improvements in Model1. Model2 shows a number of promising improvements in defect reduction and needs to be monitored more so that the improvement is maintained.
Recommendations will be towards improving quality control at Model1 for process stabilization and reduction in defects. Line workers at Model1 need special training with the aim of closing skill gaps, especially in the soldering process. Automation in some processes, like soldering, will make it consistent and more accurate. Finally, regular monitoring of defect rates will ensure continuous improvement and make it sustainable in the long run. Such steps conform to the IPC-A-610E standards and organizational goals.
Conclusion
This report identifies how important it is to apply the integration of visual and statistical analyses in order to solve manufacturing problems. The Tableau dashboard portrayed trends and distributions of defects, while the results of ANOVA validated priority attention to Model1. It is expected that the proposed recommendations will result in a 20% reduction in defect rates and a 20% increase in production capacity, thus meeting the requirements of industry standards and long-term efficiency.
References
Realyvásquez-Vargas, A., Arredondo-Soto, K. C., Carrillo-Gutiérrez, T., & Ravelo, G. (2018). Applying the Plan-Do-Check-Act (PDCA) cycle to reduce the defects in the manufacturing industry. A case study. Applied Sciences, 8(11), 2181.
Wilson, A. R. (2012). Modelling and simulation of paradigms for printed circuit board assembly to support the UK’s competency in high reliability electronics (Doctoral dissertation, Loughborough University).
Montgomery, D. C. (2017). Design and analysis of experiments. John wiley & sons.
Igulu, K. T., Onuodu, F. E., Chaudhary, R., & Justice, P. (2023). Business Intelligence. In AI-Based Data Analytics (pp. 49-82). Auerbach Publications.