1. ASSESSMENT ONE
2. INTRODUCTION
Artificial Intelligence and Machine Learning have infiltrated public discourse thus signifying a new shift in how machines interact with and respond to the outside world. Intelligent machines are being designed within healthcare to enhance diagnostic accuracy, optimize clinical workflows and improve patient outcomes. In this context an intelligent machine is a system capable of perceiving complex medical data e.g., imaging scans and patient records, learning from clinical experience, reasoning about health conditions, and making decisions to achieve specific healthcare outcomes while imitating or augmenting human medical expertise.
While AI encompasses any technique that enables computers to mimic human intelligence, ML represents a subset of AI that provides these machines with the ability to learn from vast and intricate datasets without being explicitly programmed for every possible clinical scenario. This report illuminates the intricate mechanisms by which intelligent machines gain their cognitive abilities. It seeks to demystify the ‘learning’ process, transitioning from traditional deterministic programming to adaptive, data-driven systems that are capable of navigating the nuances of patient care. Furthermore, the most popular and efficient ML algorithms currently employed across various facets of health care will be investigated. By analyzing the problems ML solves in medicine and classifying its diverse approaches, this document aims to offer a detailed understanding of how ML stands as the cornerstone for designing and advancing intelligent machines that revolutionize diagnosis, treatment and patient management.
3. THEORETICAL FOUNDATION: HOW INTELLIGENT MACHINES LEARN
Understanding how an intelligent machine works involves grasping its capacity to learn. Unlike conventional computer programs that execute a predefined set of instructions to achieve a specific outcome (e.g., a calculator performing addition), an intelligent machine is designed to extract patterns and insights from data based on inductive inference where a model learns from specific observations to make predictions on unseen data. This allows it to improve performance on a task over time without explicit rule-based programming for every conceivable scenario.
The process of machine learning can be conceptualized in the steps below:
1. Data Collection: The machine is fed a collection of observations meant to be the raw material for learning.
2. Model Selection: A specific learning algorithm (the model) is chosen which represents the mathematical structure that will attempt to find patterns in the data.
3. Training: The algorithm iteratively adjusts its internal parameters based on the input data and corresponding correct outputs (labels). The aim is to minimize the difference between the model’s predictions and actual outputs which is achieved via an optimization process where the model’s parameters are tweaked incrementally to reduce error functions.
4. Generalization: The trained model should be able to derive meaningful insights from data it wasn’t trained on indicating true learning rather than memorization.
3.1 MACHINE LEARNING AS THE ENGINE OF ADAPTABILITY
ML provides intelligent machines with the crucial ability of adaptability and continuous improvement since it’s impossible for human programmers to foresee and hard-code every scenario an intelligent system might encounter. ML algorithms enable machines to:
- Discover hidden patterns: ML algorithms can detect subtle and complex patterns missed by humans in large datasets. This leads to insights and decision-making capabilities that would be unattainable.
- Automate decision-making: Since intelligent machines operate in environments with noisy or incomplete data, ML models learn to make probabilistic decisions while adjusting their confidence based on the data. This is vital for autonomous driving or medical diagnosis tasks.
- Scale and personalize: ML allows intelligent systems to scale their intelligence across millions of users or complex situations without needing individual programming e.g., personalized health monitoring where the system adapts its intelligence to each user’s unique data.
- Continuously learn and evolve: Even after deployment machines continue learning from new data to refine their models and improve performance over time. This iterative learning cycle is crucial for maintaining relevance and effectiveness in rapidly changing environments. For example, a spam filter continuously learns from new incoming emails and user feedback.
4. TYPES OF LEARNING PROBLEMS IN MACHINE LEARNING
ML algorithms are categorized based on the type of problem they solve and the nature of the data available for learning. The three fundamental types of learning problems are classification, regression, and optimization.
4.1 CLASSIFICATION
This is a supervised learning problem where the goal is to predict a discrete categorical label for an input data point with the output variable being a category or a class. The model learns from a dataset where each input example is associated with a known class label. Once trained, the model can assign new and unseen data points to predefined categories. Examples include:
- Disease Diagnosis: Classifying a patient’s condition as diabetic or non-diabetic based on blood test results and symptoms (Binary Classification).
- Tumor Detection: Identifying if a medical image shows a malignant, benign or no tumor (Multi-class Classification).
4.2 REGRESSION
This is another supervised learning problem but the goal is to predict a continuous numerical value rather than a discrete category. The model learns the relationship between input features and a continuous target variable from historical data to get an output variable which is a real number. Examples include;
- Hospital Readmission Rate Prediction: Estimating the likelihood (as a continuous probability or count) of a patient being readmitted to the hospital within 30 days based on their medical history and discharge plan.
- Cost of Care Prediction: Estimating the total healthcare costs for a patient over a specific period based on their diagnosis and treatment history.
4.3 OPTIMIZATION
While classification and regression are the problems often solved by ML, optimization is the underlying mathematical process that drives learning itself. In the context of Machine Learning it’s the process of finding the best set of parameters for a model that minimizes or maximizes an objective/cost function, which quantifies the difference between the model’s predictions and actual values.
During training, the learning algorithm iteratively adjusts the model’s parameters e.g., coefficients in linear regression to find the minimum value of the cost function. This minimization effectively means the model is getting better at making accurate predictions. Examples include:
- Training a Disease Prediction Model: Using algorithms like Stochastic Gradient Descent (SGD) to adjust a model’s parameters to minimize errors in predicting disease presence based on patient data.
- Hyperparameter Tuning for Diagnostic Models: Finding the optimal hyperparameters e.g., the no. of layers in a neural network for image analysis involves a process to identify the configuration that yields the highest diagnostic accuracy on a validation dataset.
5. TAXONOMY OF MACHINE LEARNING ALGORITHMS
The following terminology and concepts define the machine learning landscape:
5.1 FOUNDATIONAL TERMINOLOGY
- Feature: It’s the input variable used by the model as an individual measurable characteristic of a phenomenon being observed. In disease diagnosis, features might include patient age, blood pressure reading or genetic markers.
- Label: The output variable that we are trying to predict. In supervised learning, it’s the correct answer for each input data point. In disease diagnosis, the diagnosis itself (positive or negative) would be the label.
- Model: The algorithm or mathematical construct that learns the relationship between features and labels. It’s the output of the learning process which is now capable of making predictions or identifying patterns.
- Training: The process of feeding the algorithm data (features and labels) to learn patterns & relationships. Here the model adjusts its internal parameters to minimize errors.
- Testing: The process of evaluating a model’s performance on unseen data after training to provide an unbiased estimate of how well the model understands new data.
- Validation: An optional but crucial step where a dataset distinct from training and testing is used to tune hyperparameters or compare different models. It prevents overfitting to the training data before final evaluation on the test set. A robust validation process helps ensure the model is generalizable to diverse patient populations.
- Evaluation: The process of assessing a trained model’s performance using various metrics relevant to the problem type.
| Classification | Regression |
| Accuracy, F1 score | (Mean Absolute Error) MAE |
| Precision, Recall | (Root Mean Squared Error) RSME |
| AUC-ROC | R-squared |
| Sensitivity, Specificity |
5.2 MACHINE LEARNING VS DEEP LEARNING
- Machine Learning: A broad field within AI where algorithms learn from data and includes a wide range of techniques from simpler statistical models (linear regression) to more complex ones (Support Vector Machines or Decision Trees). Many traditional algorithms require significant feature engineering (manual extraction and selection of relevant features) by human experts. In healthcare traditional ML is often used for structured data from Electronic Health Records.
- Deep Learning (DL): A subfield of machine learning that utilizes artificial neural networks with multiple layers. DL can automatically learn hierarchical representations or features from raw data thus reducing the need for manual feature engineering. This makes it powerful for complex tasks like image recognition (medical image analysis) and natural language processing (understanding clinical notes). DL models typically require very large datasets and significant computational resources for training.
5.3 COMMON CHALLENGES: OVERFITTING, UNDERFITTING AND HYPERPARAMETERS
- Overfitting: Occurs when a model learns the training data too well including noise and outliers. An overfit model performs exceptionally well on training data but poorly on unseen/test data. In healthcare an overfit diagnostic model might incorrectly diagnose patients based on false correlations in the training data leading to misdiagnosis in real-world clinical settings. Using more data, regularization techniques, cross validation and reducing model complexity mitigates overfitting
- Underfitting: Occurs when a model is too simple to capture the underlying patterns in the training data. An underfit model performs poorly on both training and testing data. In healthcare an underfit model can fail to identify critical risk factors for a disease leading to misdiagnoses or suboptimal treatment plans. This is mitigated via increasing model complexity, adding more relevant features and reducing regularization.
- Hyperparameter: A parameter whose value is set before the learning process begins thus controlling the overall behavior and learning process of the algorithm e.g., the number of clusters (k) in K-Means clustering for patient segmentation. Selecting the optimal hyperparameters is crucial for model performance and often involves techniques like grid search or Bayesian optimization on a validation dataset. Improper hyperparameter tuning leads to overfitting or underfitting which can have significant implications for patient safety and efficacy in healthcare applications.
6. ML ALGORITHMS AND THEIR PROBLEM-SOLVING APPROACHES IN HEALTHCARE
6.1 SUPERVISED LEARNING ALGORITHMS
Supervised learning in healthcare is characterized by the presence of labeled medical data where each patient record or diagnostic image in the training set is paired with a corresponding known outcome (e.g., disease presence or treatment response). The algorithm’s task is to learn a mapping function from patient data (inputs) to clinical outcomes (outputs) allowing it to predict outcomes for new and unseen patient cases.
6.1.1 K-NEAREST NEIGHBORS (KNN)
KNN is a simple non-parametric instance-based learning algorithm used for classification and regression tasks. In healthcare it makes predictions for a new patient by finding the ‘k’ closest similar patients (neighbors) in a historical medical dataset based on features like symptoms and lab results. For classification e.g., diagnosis, the new patient is assigned the most common diagnosis among their k nearest neighbors and for regression e.g., predicting recovery time, the new patient is assigned the average recovery time of their k nearest neighbors.
Its simplicity and non-parametric nature make it effective for rapidly classifying patients with complex symptom profiles or in situations where underlying data distributions are unknown. For example, if a patient presents a unique set of symptoms and lab results, KNN can identify and group this patient based on previously diagnosed patients with similar profiles from a large medical database. Its power lies in quickly suggesting potential diagnoses purely on historical similarity even for conditions with subtle or non-linear symptom presentations without needing complex model training.
6.1.2 SUPPORT VECTOR MACHINES (SVM)
SVMs are powerful learning models used for classification and regression but are more effective in classification. In healthcare the core idea is to find an optimal hyperplane that best separates different patient groups e.g., diseased vs healthy in a high-dimensional feature space derived from patient data e.g., genomic markers. The optimal hyperplane maximizes the margin between the closest training data points of any class known as support vectors. For non-linearly separable data SVMs use the kernel trick to map patient data into higher-dimensional spaces where a linear separation becomes possible. This trick allows them to model complex non-linear decision boundaries crucial for distinguishing subtle clinical differences. They are robust against overfitting especially after regularization.
In cancer diagnosis from microscopic images, SVMs can classify tissue samples as malignant or benign. Their power comes from their ability to handle thousands of high-dimensional image features e.g., cell morphology and identify subtle but complex non-linear patterns that distinguish cancerous cells from healthy cells thus providing robust and accurate diagnostic aid.
6.1.3 LOGISTIC REGRESSION (LR)
LR is primarily used for binary classification tasks where in healthcare it models the probability of a binary outcome e.g., disease present or disease absent. It uses a logistic/sigmoid function to map any real-valued combination of patient features into a probability value between 0 and 1. A clinical threshold of 0.5 or more is then applied to these probabilities to assign a class label e.g., a diagnosis. Its simplicity, efficiency and high interpretability makes it advantageous in clinical settings. The model’s coefficients can be directly interpreted as the impact of each patient feature on the log-odds of the outcome. It provides probabilistic outputs which are valuable for clinicians in assessing the likelihood of an event e.g., there’s an 85% chance of readmission rather than a binary yes/no.
LR can estimate the probability of a patient being readmitted within 30 days based on their age, no. of comorbidities, discharge medications etc. Its power lies in transparency where clinicians can understand which factors e.g., each additional comorbidity increases the odds of readmission by X % contributes to the risk and use the output to prioritize follow-up care for high-risk patients.
6.1.4 LINEAR REGRESSION
Linear Regression is used for regression problems where in healthcare it models a linear relationship between a continuous dependent variable (the clinical outcome) and one or more independent variables (patient features). It finds the line of best fit that minimizes the sum of squared differences between the predicted and actual values. Its simple and highly interpretable nature provides clear insights into how changes in features affect the target clinical outcome.
In predicting a patient’s long-term blood glucose levels based on their average daily caloric intake, exercise regimen and insulin dosage, Linear Regression can quantify this relationship. Its power is in providing a clear and interpretable model that can help patients and doctors understand the direct impact of lifestyle and treatment adjustments (“every extra 100 calories per day is associated with a 5 mg/dl increase in glucose”) on a critical health metric.
6.2 UNSUPERVISED LEARNING ALGORITHMS
Unsupervised learning in healthcare deals with unlabeled medical data where there are no predefined output labels for patient groups or clinical outcomes. The algorithm’s goal is to find hidden patterns or groupings within the data itself which can then inform clinical decision-making or research.
6.2.1 CLUSTERING
The objective is to group a set of patients or medical records in such a way that those in the same group (called a cluster) are more similar to each other e.g., in terms of symptoms or genetic profiles than to those in other groups.
- K-Means Clustering: An iterative algorithm that partitions data points into K predefined clusters and works by;
- Randomly initializing K cluster centroids (representative points for each cluster).
- Assigning each patient data point to the closest centroid.
- Recalculating the centroids as the mean of all data points assigned to that cluster.
- Repeating steps b and c until centroids no longer change significantly.
- Hierarchical Clustering: Builds a hierarchy of clusters and can be:
- Agglomerative (bottom-up): Each patient record starts as its own cluster and pairs of clusters are successively merged based on similarity until all records are in one large cluster or a stopping criterion is met.
- Divisive (top-down): All patient records start in one large cluster, which is then recursively split into smaller more homogenous clusters.
Clustering reveals inherent structures in complex patient data without prior knowledge of groupings. K-Means is efficient for large patient datasets while Hierarchical clustering provides a visual dendrogram that helps in understanding the natural grouping structure at different granularities which can be invaluable for personalized medicine.
In identifying patient subgroups for personalized medicine, these algorithms can analyze large datasets of patients with a particular chronic disease based on their genetic markers or lifestyle data and response to various medications. Its power lies in uncovering novel naturally occurring patient phenotypes e.g., distinct subgroups that respond differently to the same treatment that might not be obvious through traditional clinical observations. This enables more targeted and effective treatment strategies.
6.3 REINFORCEMENT LEARNING (RL)
RL in healthcare is a type of ML where an agent e.g., a treatment recommendation system learns to make a sequence of decisions by performing actions in a simulated or real environment e.g., a patient’s health status to maximize a cumulative reward e.g., improved patient health. There are no labelled inputs or outputs and the agent learns via trial and error, receiving feedback in the form of positive rewards for desirable clinical outcomes or penalties for undesirable events. Core concepts include:
- Agent: The learning entity e.g., drug dosage algorithm
- Environment: The patient’s physiological state or a simulated medical scenario
- State: The patient’s context or current medical condition.
- Action: A decision or intervention made by the agent e.g., adjusting drug dosage.
- Reward: A numerical feedback signal received by the agent after taking an action. It indicates the desirability of that action for patient outcomes e.g., positive for improved health or negative for adverse events.
- Policy: The strategy used by an agent to map states to action. The goal of RL is to learn an optimal policy that leads to the best long-term patient outcomes.
In optimizing treatment for critically ill patients in an ICU an RL agent can learn to recommend optimal interventions e.g., adjusting fluid levels or medication dosages in real time. The agent receives rewards for improving patient vitals and penalties for deterioration. Since RL excels in sequential decision-making problems, its power lies in enabling highly personalized and adaptive treatment strategies that account for a patient’s continuously changing physiological state. This allows healthcare systems to learn adaptive clinical behaviors without explicit programming which leads to potentially better outcomes and faster recovery times than static protocols especially for complex and fluctuating conditions.
7. EFFICIENCY DEMONSTRATION: IMPLEMENTATION OF SUPERVISED ALGORITHMS
For this demonstration, code implementations for KNN (classification) and Linear Regression (regression) in google colab have been provided. These examples will use scikit-learn, a popular and efficient machine learning library in Python and simple synthetic datasets to ensure reproducibility and clarity.
7.1 KNN IMPLEMENTATION
The code below simulates a scenario where there’s patient data with two markers and a known disease status (0 or 1).
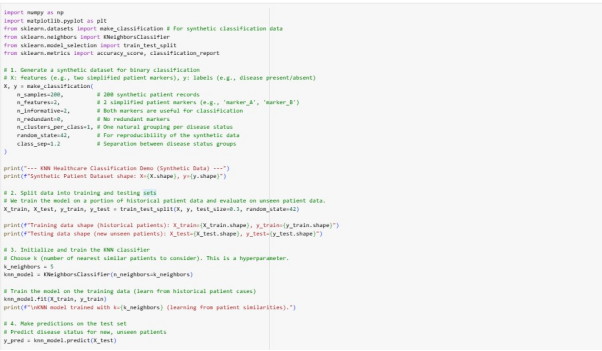
It generates a synthetic dataset (make_classification) to represent patients and the data is split into training and testing sets. A KNeighborsClassifier is initialized with n_neighbours=5 (a hyperparameter representing how many similar patients to consider). The model is fit on the training data to ensentially memorize the historical patient cases.
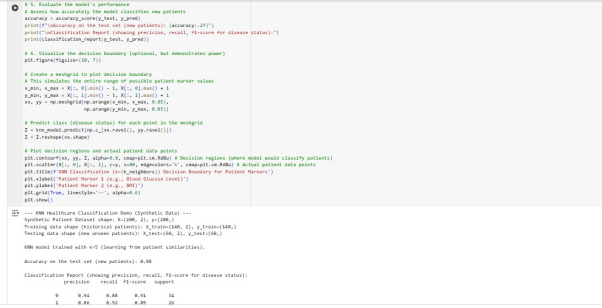
Finally, predictions are made on the test set and a detailed classification report are printed.
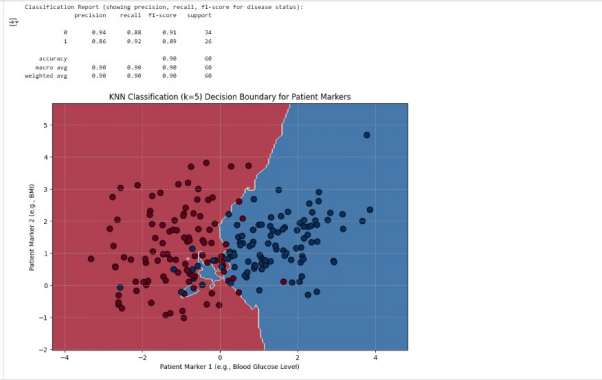
This visualization shows the decision boundary learned by the KNN model. The red and blue regions represent where the model would classify new patients based on their Patient Marker 1 and 2 values. The irregular non-linear shape of the boundary demonstrates KNN’s power in adapting to complex data patterns, effectively separating the two patient groups based on their proximity to existing labeled patients.
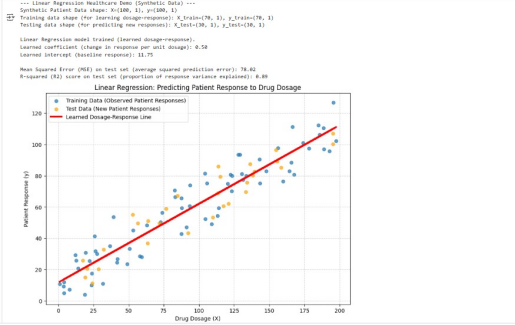
7.2 LINEAR REGRESSION IMPLEMENTATION
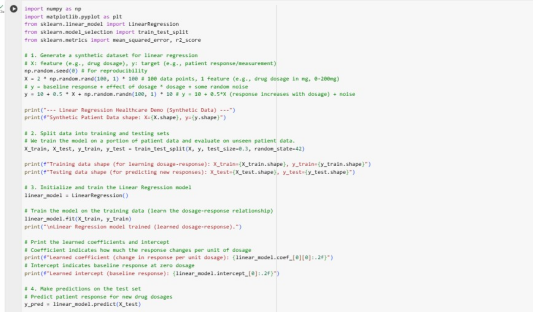
The code below generates a synthetic dataset that simulates a drug-dosage-response relationship where x could be drug dosage and y could be a physiological response e.g., reduction in symptom score. A LinearRegression model is initialized and fit on the training data to learn the relationship between dosage and response. The learned coefficient/slope indicates the change in patient response per unit of drug dosage and the intercept represents the baseline response. Predictions are then made on the test set and MSE and R-squared (R2) are used as evaluation metrics.
The plot below visualizes the scattered data points (observed patient responses) and the red learned Dosage-Response line that the model found. Since this line closely follows the general trend of the data including both training and test points, this visually confirms the model’s effectiveness in establishing a linear relationship.
8. MACHINE LEARNING IN DESIGNING INTELLIGENT MACHINES
The true essence of an intelligent machine in medical contexts lies in its capacity for adaptability, generalization and autonomous learning from heterogenous patient data which are fundamentally enabled by machine learning. Traditional programming struggles with:
- Handling Medical Complexity and Nuance: Patient data is complex, high dimensional and often noisy, encompassing everything from EHRs, imaging scans and real-time sensor data. ML algorithms especially deep learning for unstructured data like images and text excel at identifying intricate patterns and hierarchical representations in vast complex medical data that would be impossible for human experts or rule-based systems to capture comprehensively. DL detects cancerous lesions in radiology scans with high accuracy and identify features imperceptible to the human eye.
- Adapting to Dynamic Clinical Environments: Traditionally programmed systems need frequent and costly manual updates in the ever-changing healthcare landscape. However, ML driven intelligent machines continuously learn from new clinical data while self-optimizing and adapting their diagnostic recommendations in real time. This dynamic learning allows personalized medicine systems to adjust treatment plans based on evolving patient responses.
- Discovery of Unforeseen Medical Insights: ML can discover novel correlations and treatment efficacies that aren’t immediately obvious to human researchers. This is crucial in drug discovery and identifying optimal patient cohorts for clinical trials which can accelerate medical breakthroughs.
- Personalization and Precision Medicine at Scale: Delivering intelligent healthcare experiences tailored to individual patients requires processing and learning from massive amounts of unique patient data. ML algorithms automate this personalization at scales impossible for human clinicians thus moving healthcare from a one-size-fits-all approach to truly precision medicine.
9. CONCLUSION
A comprehensive taxonomy and examples of machine learning algorithms was presented that demystifies core terminology such as features (e.g., patient vitals, lab results), labels (e.g., diagnosis, treatment response), models, and the crucial distinction between training, testing, and validation, all within a healthcare context. The challenge of overfitting (leading to misdiagnosis) and underfitting (missing critical insights) along with the careful tuning of hyperparameters were identified as critical considerations in developing robust medical ML models. Machine Learning empowers machines to move beyond deterministic programming, enabling them to learn from complex medical data while identifying intricate clinical patterns to make informed decisions autonomously. This capability for adaptive learning is what truly distinguishes an intelligent medical machine from a mere automated system.
ASSESSMENT 2
1. EXECUTIVE SUMMARY
This report contains the implementation and testing of machine learning models for predicting patient readmissions in HealthShield. Comprehensive data preprocessing steps, training of multiple classification and regression algorithms has been done using a dataset similar to typical hospital readmissions data. The aim is to identify robust models capable of assisting healthcare providers in proactive patient management. A critical assessment of model performance to determine instances of underfitting, overfitting, or balanced solutions, culminating in a recommended best model and suggestions for future enhancements is included.
2. DATASET DESCRIPTION
The dataset includes patient encounters in hospital setting which is designed to facilitate the prediction of a patient’s readmission status. It has 17 columns and 25000 rows, all of which have null values. The main data types are integers and objects.
The columns are described below:
- “age” – age bracket of the patient
- “time_in_hospital” – days (from 1 to 14)
- “n_procedures” – number of procedures performed during the hospital stay
- “n_lab_procedures” – number of laboratory procedures performed during the hospital stay
- “n_medications” – number of medications administered during the hospital stay
- “n_outpatient” – number of outpatient visits in the year before a hospital stay
- “n_inpatient” – number of inpatient visits in the year before the hospital stay
- “n_emergency” – number of visits to the emergency room in the year before the hospital stay
- “medical_specialty” – the specialty of the admitting physician
- “diag_1” – primary diagnosis (Circulatory, Respiratory, Digestive, etc.)
- “diag_2” – secondary diagnosis
- “diag_3” – additional secondary diagnosis
- “glucose_test” – whether the glucose serum came out as high (> 200), normal, or not performed
- “A1Ctest” – whether the A1C level of the patient came out as high (> 7%), normal, or not performed
- “change” – whether there was a change in the diabetes medication (‘yes’ or ‘no’)
- “diabetes_med” – whether a diabetes medication was prescribed (‘yes’ or ‘no’)
- “readmitted” – if the patient was readmitted at the hospital (‘yes’ or ‘no’)
3. DATA PREPROCESSING
The dataset is loaded using the pandas library.

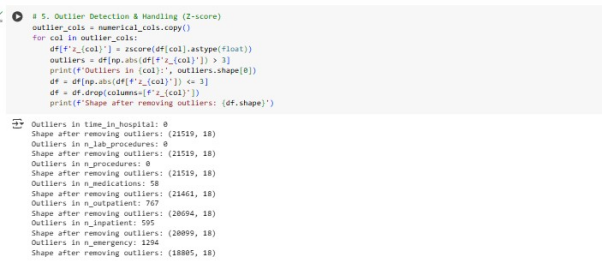
Since the dataset has no missing values, techniques such as filling missing values using median/mode for numerical/categorical features have not been applied. Outliers in numerical features have been detected and removed using the Z-score.
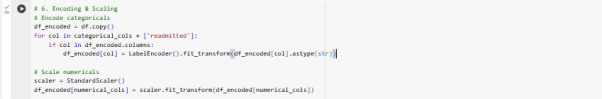
Numerical features have scaled to ensure that no single feature dominates the learning process using the standard scaler. Categorical features have been converted into numerical format via using label encoder from the sklearn. processing module.
An 80% training set / 20% testing set split was used to divide the dataset into training and testing sets to evaluate the model’s generalization capabilities.
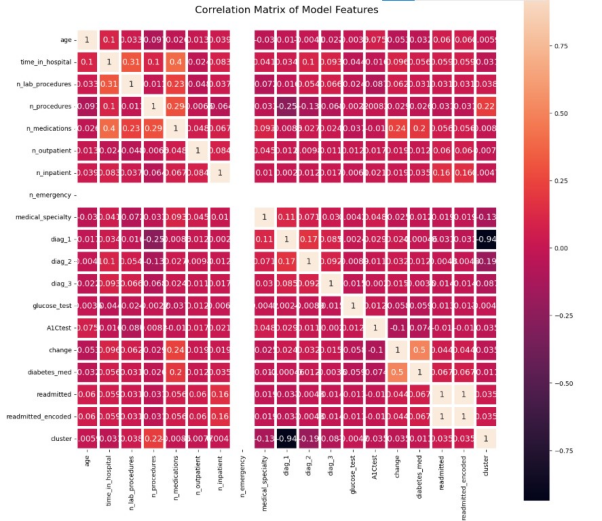
Features with a correlation coefficient within the threshold of (0.05 to -0.05) to the predicted variable (‘readmitted’) were used to train the model.
4. MODEL TRAINING
Three ML models- Logistic Regression, Random Forest, KNN and Decision Tree Regressor have been used to train for both classification (predicting readmission) and regression (predicting time in hospital). All models follow the procedure below:
- Set up the data
- Train model on training data
- Test model on testing data
- Evaluate performance
5. MODEL EVALUATION
To assess the model’s performance, metrics like the confusion matrix, accuracy, precision, recall, F1-score, MSE and RSME will be used.
- F1 Score: It’s the harmonic mean of precision and recall.
- Accuracy: It measures the proportion of correct predictions made by the model over the total number of predictions.
- Recall Score: It measures the ability of a model to identify all relevant instances (True Positive) while minimizing the number of false negatives.
- Precision: It’s used for the determination of the proportion of positive prediction that was actually correct.
- Confusion Matrix: It’s a tabular representation of the number of true positives, true negatives, false positives, and false negatives detected by the model.
- MSE: It quantifies the average squared difference between predicted and actual values.
- RSME: It quantifies how spread-out prediction errors are which indicates the accuracy of a model’s predictions.
6. MODEL RESULTS
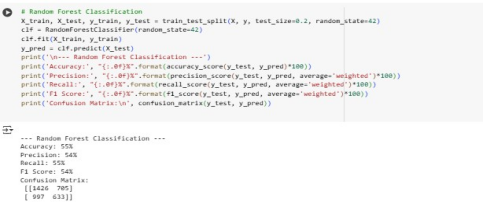
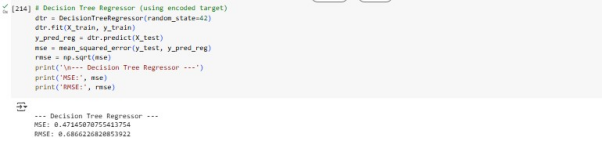
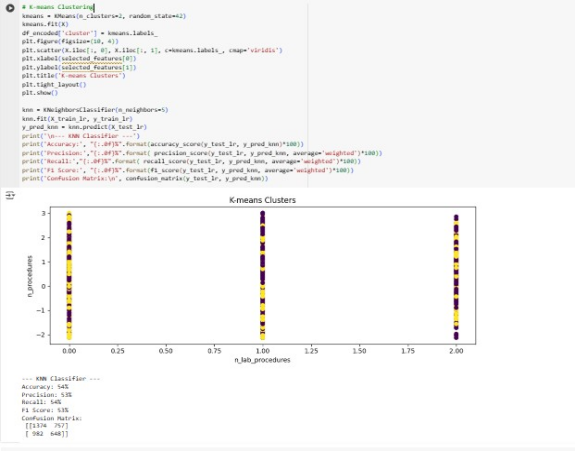
Overall, Logistic regression had the highest performance in all metrics when compared to Random Forest and KNN with performance scores of above 57%. Random Forest has a higher F1-score of 54% than the other models. The low MSE and RSME values for Decision tree Regressor indicates good performance.
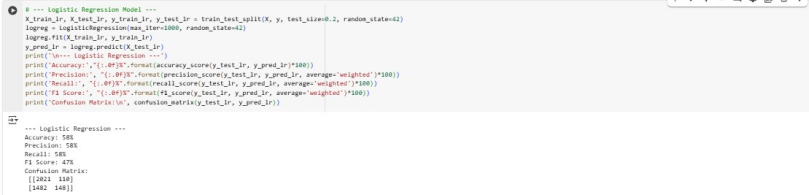
Since the accuracy, precision and recall are below 70%, this suggests that the models are underfitting. This means the models have not well understood the training data. The best model remains to be Linear Regression due to its higher performance and ease of interpretability. To increase performance, the LR model should be trained with more high-quality data and its complexity should be increased.
7. CONLUSION
The analysis concludes that Linear Regression model is the best one out of the four. This shows its effectiveness in understanding linear separable data in the dataset. Even though the low accuracy score indicates overfitting, this can be improved by training it longer, increasing its complexity, adding more relevant features and reducing noise.
REFERENCES
Alanazi, A. (2022) ‘Using machine learning for healthcare challenges and opportunities,’ Informatics in Medicine Unlocked, 30, p. 100924. https://doi.org/10.1016/j.imu.2022.100924.
Balaha, H.M. and Hassan, A.E.-S. (2022) ‘Skin cancer diagnosis based on deep transfer learning and sparrow search algorithm,’ Neural Computing and Applications, 35(1), pp. 815–853. https://doi.org/10.1007/s00521-022-07762-9.
Jayatilake, S.M.D.A.C. and Ganegoda, G.U. (2021) ‘Involvement of machine learning tools in healthcare decision making,’ Journal of Healthcare Engineering, 2021, pp. 1–20. https://doi.org/10.1155/2021/6679512.
Javaid, M. et al. (2022) ‘Significance of machine learning in healthcare: Features, pillars and applications,’ International Journal of Intelligent Networks, 3, pp. 58–73. https://doi.org/10.1016/j.ijin.2022.05.002.
Manickam, P. et al. (2022) ‘Artificial intelligence (AI) and Internet of Medical Things (IOMT) assisted biomedical systems for intelligent healthcare,’ Biosensors, 12(8), p. 562. https://doi.org/10.3390/bios12080562.
Marutho, D. et al. (2018b) ‘The determination of cluster number at K-Mean using elbow method and purity evaluation on Headline News,’ 2018 International Seminar on Application for Technology of Information and Communication, pp. 533–538. https://doi.org/10.1109/isemantic.2018.8549751.
Manickam, P. et al. (2022) ‘Artificial intelligence (AI) and Internet of Medical Things (IOMT) assisted biomedical systems for intelligent healthcare,’ Biosensors, 12(8), p. 562. https://doi.org/10.3390/bios12080562
Nafea, A.A. et al. (2024b) ‘A short review on supervised machine learning and deep learning techniques in computer vision,’ Deleted Journal, 2024, pp. 48–55. https://doi.org/10.58496/bjml/2024/004.
Nasr, M. et al. (2021) ‘Smart healthcare in the age of AI: recent advances, challenges, and future prospects,’ IEEE Access, 9, pp. 145248–145270. https://doi.org/10.1109/access.2021.3118960.
Siddique, S. and Chow, J.C.L. (2021) ‘Machine learning in healthcare communication,’ Encyclopedia, 1(1), pp. 220–239. https://doi.org/10.3390/encyclopedia1010021.
Soori, M., Arezoo, B. and Dastres, R. (2023) ‘Artificial intelligence, machine learning and deep learning in advanced robotics, a review,’ Cognitive Robotics, 3, pp. 54–70. https://doi.org/10.1016/j.cogr.2023.04.001.