- “What is the ANOVA table of the best model”?
ANS: The best regression model was reading ability estimated by age with R2 = 0.716, implying that age of children in the sample was able to explain 71.6% variation in reading ability. The corresponding ANOVA table has been provided underneath.
Table 1: ANOVA table of regression model of reading ability on age
| df | SS | MS | F | Significance F | ||
| Regression | 1 | 6.427 | 6.427 | 45.313 | 0.000 | |
| Residual | 18 | 2.553 | 0.142 | |||
| Total | 19 | 8.980 | ||||
- “What is the regression equation of the best model”?
ANS: The estimated regression equation is Reading ability = 3.032 +Age * 0.542
- “Conduct the test for the significance of the Overall Regression Model for the best model”?
ANS:
Null hypothesis: H0:: The regression model without any predictor fits the data equally well (model with constant only fits equally good compared to model with the predictor age).
Alternate hypothesis: H0:: The regression model with age as predictor fits better than the constant only model.
Level of significance: 5%
Test statistics: F = 45.313, and p-value < 0.05.
Conclusion: The sample data with age as the predictor provides sufficient substantiation to infer that the overall regression model fits better compared to the constant only model.
- “What is R2 of the best model”?
ANS: The best regression model was reading ability estimated by age with R2 = 0.716
- “For the best model, what are the 95% confidence intervals for the estimates of the regression coefficients—the Bi’s”?
ANS: The 95% confidence interval for Bi of age was [0.373, 0.711], implying that there was 95% chance that regression coefficient of age would be somewhere between 0.373 and 0.711.
- “Provide an interpretation of the slopes, bi’s”.
ANS: The regression slope for age was β1 = 0.542, which implied that for increase in age of a child by one year would increase his/ her reading ability by 0.542 units.
- “What is the ANOVA table of the best model”?
ANS: The best regression model was reading ability estimated by age and IQ of children.
Table 2: ANOVA table of regression model of reading ability on age and IQ
| df | SS | MS | F | Significance F | |
| Regression | 2.000 | 7.374 | 3.687 | 39.018 | 0.000 |
| Residual | 17.000 | 1.606 | 0.094 | ||
| Total | 19.000 | 8.980 |
- “What is the regression equation of the best model”?
ANS: The estimated regression equation is Reading ability = Age * 0.584 + IQ * 0.036 – 0.703.
- “Conduct the test for the significance of the Overall Regression Model for the best model”?
ANS:
Null hypothesis: H0:: The regression model without any predictors fits the data equally well compared to the model with predictors (age and IQ).
Alternate hypothesis: H0: The regression model with age and IQ as predictors fits better than the constant only model, and at least one βi is non-zero.
Level of significance: 5%
Test statistics: F = 39.018, and p-value < 0.05.
Conclusion: The sample data with age and IQ as predictors provide sufficient substantiation to infer that the overall regression model fits better compared to the constant only model, and there is at least one non-zero regression coefficient in the model.
- “What is R2 of the best model”?
ANS: The best regression model with reading ability estimated by age and IQ has R2 = 0.821.
- “For the best model, what are the 95% confidence intervals for the estimates of the regression coefficients—the Bi’s”?
ANS: The 95% confidence interval for β1 for age was [0.443, 0.726], and 95% confidence interval for β2 for IQ was [0.012, 0.060].
- “Provide an interpretation of the slopes, bi’s”.
ANS: The regression slope for age was β1 = 0.584 and it implied that for increase in age of a child by one year would increase his/ her reading ability by 0.584 units, while a constant level of IQ. The regression slope for IQ was β2 = 0.036 and it implied that for increase in IQ of a child by one unit would increase his/ her reading ability by 0.036 units, while age is kept constant.
- “What is the ANOVA table of the model”?
Table 2: ANOVA table of regression model of reading ability on age, memory span and IQ
| df | SS | MS | F | Significance F | |
| Regression | 3 | 7.498 | 2.499 | 26.982 | 0.000 |
| Residual | 16 | 1.482 | 0.093 | ||
| Total | 19 | 8.980 |
- What is the regression equation of the model?
ANS: The estimated regression equation is Reading ability = Age * 0.466 + IQ * 0.025 + Memory Span * 0.269 – 0.106.
- Conduct the test for the significance of the Overall Regression Model for the model?
ANS:
Null hypothesis: H0:: The regression model without any predictors fits the data equally well compared to the model with predictors (age, memory span and IQ).
Alternate hypothesis: H0: The regression model with age and IQ as predictors fits better than the constant only model, and at least one βi is non-zero.
Level of significance: 5%
Test statistics: F = 26.982, and p-value < 0.05.
Conclusion: The sample data with age, memory span and IQ as predictors provide sufficient substantiation to infer that the overall regression model fits better compared to the constant only model, and there is at least one non-zero regression coefficient in the model.
- “What is R2 of the best model”?
ANS: The regression model with reading ability estimated on age, memory span and IQ has coefficient of determination as R2 = 0.835.
- “What are the 95% confidence intervals for the estimates of the regression coefficients—the Bi’s”?
ANS: The 95% confidence intervals for age, memory span and IQ are as follows.
Age: [0.208 , 0.724]
Memory span: [-0.224, 0.762]
IQ: [-0.007, 0.056]
- “Provide an interpretation of the slopes, bi’s”.
ANS: The regression slope for age was β1 = 0.466, which implied that for increase in age of a child by one year would increase his/ her reading ability by 0.466 units, while constant levels of memory span and IQ.
The regression slope for IQ was β2 = 0.025, which implied that for increase in IQ of a child by one unit would increase his/ her reading ability by 0.025 units, while age and memory span are kept constant.
The regression slope for memory span was β3 = 0.269, which implied that for increase in memory span of a child by one unit would increase his/ her reading ability by 0.269 units, while age and IQ are kept constant.
ANS: The best regression model was chosen comparing model 5 and model 7. Adjusted R2 for model 5 was 0.8, and for model 7 it was 0.804. Hence, no major difference in model explanation by the predictors was noted. But, in model 7, IQ (t = 1.643, p = 0.120) and memory span (t = 1.158, p = 0.264) were found to be statistically not significant enough to estimate reading ability. Contrary, in model 5 the predictors, age (t= 8.711, p < 0.05) and IQ (t = 3.165, p < 0.05) were noted to be statistically significant. Hence, model 5 was chosen as the best regression model.
The regression equation was: Reading ability = Age * 0.584 + IQ * 0.036 – 0.703.
The core matrix was evaluated using excel as,
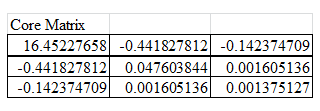
The 95% confidence interval for reading ability was evaluated as [2.936, 11.631] for age = 6, IQ = 91, and constant term = – 0.703.
The 95% prediction interval for reading ability was evaluated as [2.887, 11.679] for age = 6, IQ = 91, and constant term = – 0.703.
- “Conclude the presentation with recommendations for further research”.
ANS: A longitudinal study with more than 50 children will be few scope of future research for estimating reading ability on age, memory span and IQ. Large sample size will boost the reliability of the regression model results. Particularly, collecting pre and post period data will provide the scope for comparative study for reading ability (Alloway, & Alloway, 2010).
References
Alloway, T. P., & Alloway, R. G. (2010). Investigating the predictive roles of working memory and IQ in academic attainment. Journal of experimental child psychology, 106(1), 20-29.