Task 1
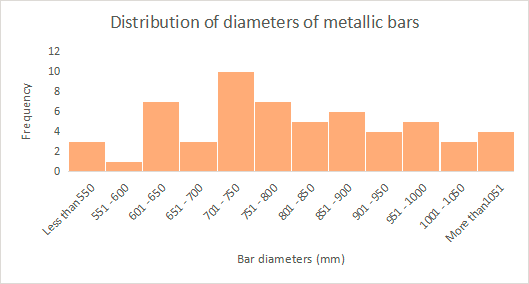
istogram for diameters of metallic bars
From the histogram seems to be right skewed.
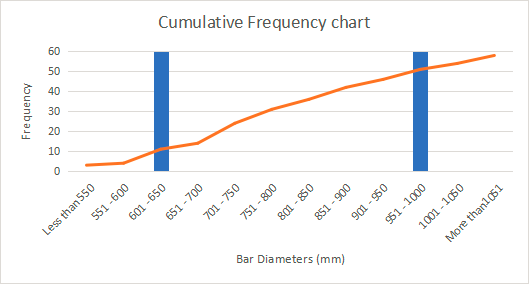
Cumulative Frequency chart showing lower and higher quartile boundaries
| Summary Statistics | Values |
| Mean | 807.14 |
| Median | 790.50 |
| Mode | 842.00 |
| Variance | 22447.74 |
| Standard deviation | 149.83 |
From the histogram it is observed that the distribution of diameter of the metallic bars is right skewed. Further, we observed that Mean > Median, thus the distribution is positively skewed. Hence, median would be the ideal method for the measurement of central tendency.
Task 2
Part a
The first step would be creating a frequency table for the mean rod length for the current week. In order to create the frequency table first the minimum and maximum values of the rod length would be found. Then adequate class width table created. Using the “Frequency” command the frequency table would be created.
From the frequency table, the histogram would be created.
In the next stem, the mean, standard deviation, count of the rod-lengths are calculated. In addition, the value for z = 99.5% is put as 2.807.
Further, the CI for 99.5% is calculated by using the formula
A line chart with time on the x-axis and the values of mean , lower CI and upper CI on the y-axis.
Part b
| Class Width | Frequency | Frequency Formula |
| Less than 99.96 | 1 | {=FREQUENCY(A3:A52,K3:K13)} |
| 99.96 – 99.97 | 2 | {=FREQUENCY(A3:A52,K3:K13)} |
| 99.97 – 99.98 | 4 | {=FREQUENCY(A3:A52,K3:K13)} |
| 99.98 – 99.99 | 8 | {=FREQUENCY(A3:A52,K3:K13)} |
| 99.99 – 100 | 13 | {=FREQUENCY(A3:A52,K3:K13)} |
| 100 – 100.01 | 10 | {=FREQUENCY(A3:A52,K3:K13)} |
| 100.01 – 100.02 | 7 | {=FREQUENCY(A3:A52,K3:K13)} |
| 100.02 – 100.03 | 2 | {=FREQUENCY(A3:A52,K3:K13)} |
| 100.03 – 100.04 | 2 | {=FREQUENCY(A3:A52,K3:K13)} |
| 100.04 – 100.05 | 0 | {=FREQUENCY(A3:A52,K3:K13)} |
| More than 100.05 | 1 | {=FREQUENCY(A3:A52,K3:K13)} |
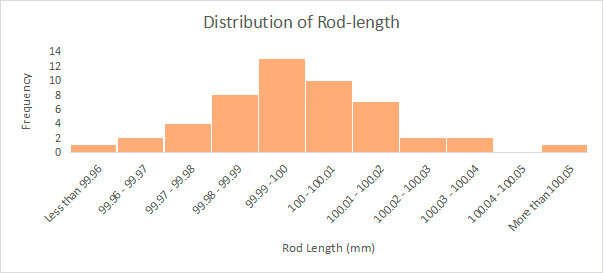
The data for the distribution of rod-length is normally distributed.
| Values | 26/04/2019 | 03/05/2019 | 10/05/2019 | 17/05/2019 | 24/05/2019 |
| Mean | 99.998 | 100.006 | 100.007 | 100.001 | 100.014 |
| Standard Deviation | 0.020 | 0.023 | 0.029 | 0.029 | 0.034 |
| Count | 50 | 50 | 50 | 50 | 50 |
| z-value | 2.807 | 2.807 | 2.807 | 2.807 | 2.807 |
| 0.0025 | |||||
| Lower CI | 99.990 | 99.997 | 99.995 | 99.989 | 100.000 |
| Upper CI | 100.006 | 100.015 | 100.018 | 100.012 | 100.028 |
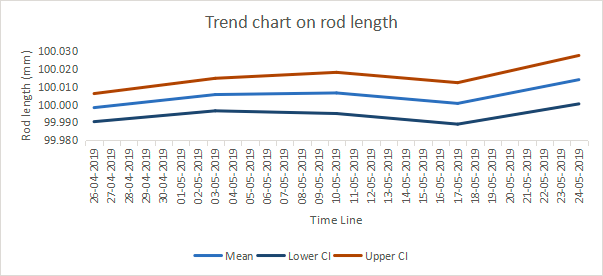
The above chart presents the trend for rod length. The rod length has a 99.5% CI which ranges from 99.90 to 100.4.
From the trend line it is observed that the requirements are not followed. The 99.5% CI lies within the given range.
Task 3
Task 4
Part a
Part i
The process of least squares method applies when there exists 1 dependent and 1 independent variable.
Thus, the values of sum X, Y, XY, X2 and Y2 is calculated.
The values are replaced in the equation
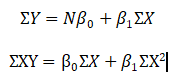
The two equations are solved to get the least square regression line.
Part ii
Excel software is very useful for making the calculations. Thus, larger values can be easily calculated. In addition, formulas can be used to calculate the repetitive values thus making the process of calculation easier.
Part iii
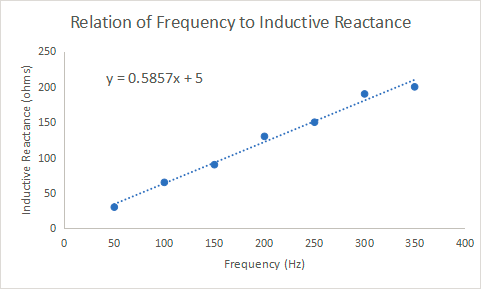
The correlation between Frequency (Hz) and Inductive Reactance (ohms) is 0.9942. The correlation is calculated using the excel function CORREL.
Part iv
fd
Part b
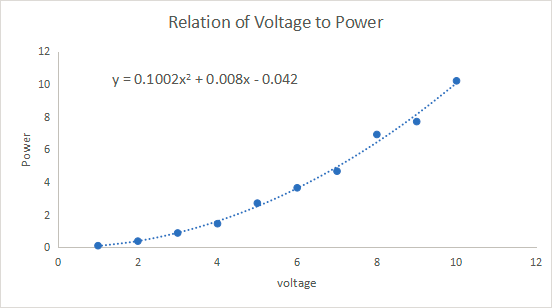
The relation between Power and voltage can be expressed as
Power = 0.1002*Voltage2 + 0.008*Voltage – 0.042
The plot agrees well with the theoretical knowledge of 10W resistors. As the voltage increases there is an exponential growth in power of the resistors.
Task 5
Study 1
Study 2
Study 3