Task 1
(a)State the base quantities of the SI system and what they are measures of
Unit name Symbol What it measures
Second s Time
Kilogram kg Mass
Metre m Length
Kelvin K Temperature
Mole mol Amount of substance
Ampere A Current
Candela cd Luminous intensity
(b)State 3 derived quantities of the SI system, what they are measures of, and from which base quantities they are derived
Derived quantity What it measures Base quantities
Hertz Frequency
Pascal Stress
Watt Power
(c)For the following 3 numerical values, convert the figures to standard scientific notation, and to standard engineering notation
265398742kg
Standard scientific notation: kg
Standard engineering notation: kg
48008900000000mStandard scientific notation: m
Standard engineering notation: m
0.00000008569 cm
Standard scientific notation: cm
Standard engineering notation: cm
Task 2
An engineering company has replaced its usual high tensile steel bolts with a less expensive alternative. The quality engineer is concerned that the performance of the bolts may not be the on a par and performs Rockwell c hardness tests on three samples of the original bolt and three samples of the replacement bolt. The table gives the results from his tests.
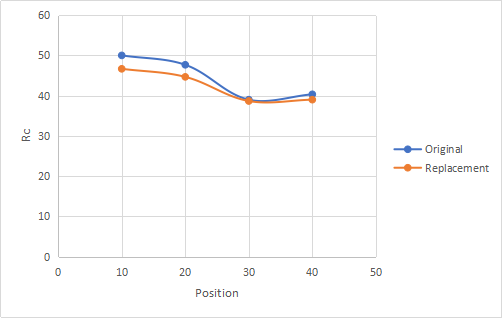
(a)Examine why the engineer chose the test (c scale) and what sort of data the test produces? Present the data using Microsoft Excel along with supporting graphical representations. Discuss the conclusions that the data allows you to draw with respect to the bolts and their replacements.
The engineer chose the c scale because it measures the bulk hardness of the bolts taking into consideration the amount of force applied on the material. The test is able to directly relate the hardness of the bolt to its strength, wear resistance among other engineering properties. It is simple to undertake and less costly. The harder the bolt, the lesser the penetration depth. C scale provides raw details of the ability of the material to carry a particular weight.
Original Bolt   Replacement
Test 1  Test 2
Sample 1    Sample 1
Position RC RC
a = 10mm 52 47
b = 20mm 50 43
c = 30mm 40 38
d = 40mm 41 39
Position Sample 2 Sample 2
a = 10mm 50 46
b = 20mm 45 43
c = 30mm 35 33
d = 40mm 38 36
Position Sample 3 Sample 3
a = 10mm 48 47
b = 20mm 48 48
c = 30mm 42 45
d = 40mm 42 42
Original bolt produced the highest HRC across all tests. This is the best bolt to use since it recorded the least penetration depth. This means that it has a relatively higher hardness as compared to other bolts.
A colleague of the quality engineer suggests that the Mohs’ Hardness scale might be useful in giving a quick indication of the relative hardness of various metals used in the company’s manufacturing processes. The quality department purchases a set of Mohs’ hardness picks and performs the test on all the metals that the company might use and gets the following results.
(b)Describe the test; examine why the engineer suggested the test and what sort of data the test produces? Present the data using Microsoft Excel along with supporting graphical charts. Discuss the conclusions that the data allows you to draw with respect to the materials the test covers.
Moh’s hardness scale measures the ability of the bolts to resist scratching by ten reference minerals. The test is performed by placing a sharp point of one reference mineral on an unmarked surface of the bolt and trying to produce a scratch. If the mineral produces a scratch on the bolt, then it is harder than the bolt.
Tungsten carbide posted the highest value of hardness. Aluminium posted the lowest value of hardness. Tungsten carbide is the best material to be used.
(c)The engineer is considering getting test specimens turned from the original bolts and their replacements and then performing tensile tests to destruction on them; three for the originals and three from the alternatives. Describe and explain the Rockwell hardness test and the tensile test to destruction. Discuss the engineers’ application of the scientific method.
Rockwell hardness test checks the depth of penetration when a load is applied to the bolt. This method investigates the lasting depth of indentation formed by a force on an indenter. A minor load is a applied first to the bolt using a diamond. This minor load breaks through the surface of the bolt to minimize the outcome of surface finish (Shen, 2001). After the minor load, a major load is applied to obtain the required load value. The force is held for a dwell time to permit for elastic recovery. It is then released reverting to minor load until the bolt breaks. After holding the minor load for a dwell time, it is released and the depth measured and recorded.
Tensile test is done to determine the yield strength, ductility and tensile strength of the bolts. Through the test we are able to determine the force needed to break the bolts and how long it changes in length. A continuous load is applied on the bolts and its change in size and length observed (.
Tensile test and Rockwell test to destruction are done to determine the maximum load the bolts are able to withstand. This is important in design to prevent damage to the bolt due to overloading.
Task 3
(a) With reference to a typical stress/strain plot for a metal and to their molecular/atomic structure, describe the following properties;
Stiffness
Stiffness refers to the ability of a material to resist deformation when a load is applied on it and return back to its original shape. When load is applied to a material, it experiences stress and strain (Horath, 2019). Strong materials with closely compact structure can resist high loads without deforming. This is observed on the stress-strain curve in the elastic region. The gradient of the curve is equivalent to the stiffness of the material.
Elastic limit
This is the maximum load a material can sustain before the start of permanent deformation. It marks the end of elastic behaviour and the start of plastic behaviour. Stresses above this point result to fracture and deformation. The structure of the material is altered permanently. On the stress-strain curve, elastic limit is the point where the material changes its property from elastic to plastic.
Plastic deformation
Occurs when a material is subjected to stresses exceeding the yield strength of the material. The stresses exceeding the yield strength results to bending, elongation, twisting, buckling and compression of molecules forming the material. It occurs just beyond the elastic limit on stress-strain curve.
Tensile strength
It is the optimum tensile stress a material can take before failure. The individual atoms contribute to the tensile strength of the material. It is the stress value at the elastic limit.
Ultimate strength
This is the maximum stress a material can resist before its failure. The weaker the atomic structure of a material is, the lower its ultimate strength. Ultimate strength occur at the point where increase in strain begins to result in decrease in stress.
Ductility
Refers to the ability of a material to be stretched to a thin size without fracturing. This the measure of tensile stress the material can withstand before undergoing plastic deformation before breaking. We get the percentage elongation at failure from the stress-strain curve to determine the ductility of the material.
(b) Polymers manifest massive strain for relatively low stress. With reference to their molecular arrangement, explain why this is so
A polymer is made up of many simple molecules referred to as monomers. These simple molecules have low ultimate strength. Therefore, low stresses are able to produce plastic deformation of the material. This in return means that high strains are realized when low stresses are applied. The chain and cross-linking of the polymers are composed of weak bonds which lengthen and break easily when subjected to low stresses.
(c)Carbon fibre and glass fibre composites manifest very high strength at very low strain. They also exhibit relatively little yielding prior to final fracture and are notable for very high stiffness. Explain why this is so
Carbon and glass fibre are made up of molecules joined together by strong covalent bonds. It is hard to break the bonds. These bonds are not easily lengthened. When subjected to high loads, the fracture without significant change in length.
Task 4
(a)The fast/brittle fracture of metals is significantly affected by temperature. Explain why this is so
Temperature affects the ductility of a material. Increase in temperature increases the ductility of the material. Ductility increases because the molecules forming the materials loses their attraction to each other when temperature increases (Zhang, 2014). Therefore, brittle fracture of material is affected by temperature.
(b)Describe the basic principles of fatigue and how the design engineer can determine the strength of a material as a function of how long it is in service
Fatigue occurs when repetitive or cycling loads are applied to a material and results to formation and propagation of cracks. As the load is applied to the material, it begins to weaken. Continued loading of a material results to its components losing the ability to take up loads. Its ability to contain more loads reduces leading to weakening of its components and formation of cracks. The design engineer observes the maximum load and time length the material takes before cracking.
(c)Describe the basic principles of creep
When a material is subjected to constant loading, deformation occurs continuously.
Creep often occur at high temperature known as thermal creep. However, it can also take place at room temperature in various materials but at slower rates (Gu, 2016).
The material is subjected to time dependent increase in length. At primary region the creep rate reduces rapidly with time.
(d)Explain the mechanics of the following degradation mechanisms;
Abrasion
Abrasion is the scratching or rubbing away of surface of a material. When the surfaces of a material are exposed to external forces and loads results to peeling of or removal of surface elements of the material.
Corrosion
Corrosion is a chemical attack on a material caused by electrochemical reaction. The materials surface is exposed to the environment which contain various chemicals. When the chemicals come into contact with the material, electrochemical reactions occur which alters the chemical composition of the surface of the material. This affects the strength and durability of the material.
Task 6
Polymers manifest a range of sub-phases within the solid phase state
(a) Explain how, during the polymerisation process, a given polymer might be altered to manifest the glassy sub-phase over a wider range of temperature
The state of polymer can be changed from glassy state to viscous state by increasing the temperature. As the temperature increases, the bond between the molecules are weakened and leads to the change in state (Penlidis, 2017). By reducing the temperatures, the molecules do not bombard to each other and their bonds become stronger.
(b)Explain why the presence of water can seriously reduce the maximum practical service temperature of a polymer
Presence of water reduce the glass transition temperature and maximum practical service temperature of a polymer by weakening the bonds between the molecules forming the polymer (Walsh, 2012). Water introduces hydrogen bonds which are very weak.
(c)Explain why a polymer when subjected to a high loading rate tends to manifest the mechanical properties of a glassy sub-phase, but when subjected to a low loading rate, tends to manifest the properties of a viscous sub-phase
Metals are ubiquitous materials in engineering products, yet the number of in-service failures or even manufacturing failures remains high
When the material is exposed to high loading rates, the molecules are forced to be closely packed increasing the attraction force between them. When there is low loading rates, the bonds between the molecules of the polymer are weakly attracted (Haward, 2012).
(d) Suggest one reason why a metal sample subjected to a tensile test did not perform as expected, but failed at a lower than expected stress
The metal may have undergone plastic deformation which reduces its performance capacity. When a load is applied on a material, the material develops weaknesses between its atoms which leads to cracks. These cracks weaken the materials ability to withstand additional loads. When lower loads are applied, the cracks deepen leading to failure.
(e)Was there a non-destructive test technique (NDT) that could have detected the phenomena you have described in part (d)? If so, describe this process
None. All methods involve subjecting the material to loads which can lead to deformation.
Task 7
Consider the circuit shown in figure 1.
Figure 1
(a)Find the total resistance of the circuit
Resistance of first series component
Resistance of second series component
and are in parallel.
Total resistance of the circuit
(b)Find the total current of the circuit
Total current
(c)Find the voltage over the 20kΩ resistor
Consider the network shown in figure 2.
Figure 2
(a)Find the 3 unknown currents
Consider the circuit shown in Figure 3.
Figure 3
(a) Use Thévenin’s theory to simply the circuit
and are in parallel and the combination forms a series with .
Effective resistance (Heydt, 2016)
Effective voltage
(b) When a load resistor of 0.9kΩ is placed across the terminals A-B, find the voltage across the resistor and the current drawn
Current drawn
Voltage across the resistor
Consider the circuit shown in Figure 4.
Figure 4
(c) Use Norton’s theorem to simplify the circuit
Effective voltage is obtained as follows
The effective current
Effective resistance
(d) Remaining with Norton’s theorem, when a load resistor of 2kΩ is placed across the terminals A-B, find the voltage across the resistor and the current drawn
Voltage across the resistor V is obtained as follows;
Current drawn
(e)For the circuit shown in Figure 4, find the value of the load resistor which if placed across the terminals A-B would dissipate the maximum power, and calculate this power
To obtain maximum power at load, the following condition must be met
Load resistor = Task 8
An AC supply voltage is introduced to a non-linear amplifier. The voltage has a peak value of 10V at a frequency of 20Hz.
(a) The amplification factor of the fundamental is 1.5, and the amplifier generates a third harmonic with an amplification factor of 0.5. Calculate and plot a graph of the two signals and the resulting compound signal using Excel.
Amplification factor
Where is the peak value of fundamental and is the peak value of third harmonic.
Therefore,
(b)Explain how complex signals can be generated from a series of simple sin or cosine waves. What series produces a square wave? What series produces a triangular wave?
Complex signals with fundamental time period T and fundamental frequency can be described in terms of sinusoidal function (Mirceski, 2007)
Where
By Fourier series analysis, we can express the waves in terms of summation of sinusoidal functions.
Square waves are produced by non-sinusoidal periodic waves which alternates at a fixed frequency (Asmar, 2016). Cosine series produces square waves and sine series produces triangular waves.
Task 9
A resistor of 400Ω is connected in series with a capacitor of 22μF and an inductor of 50mH, and a voltage is applied across it. A current of 100mA (rms) is produced.
(a) Determine the impedance at 50Hz
(b)Determine the phase angle between the voltage and current and the applied voltage when the frequency is 50Hz
A resistor of 0.2Ω is connected in series with a capacitor of 4.7μF and an inductor of 5mH, and a voltage of 0.5V (rms) is applied across it.
(c) Determine the impedance
(d)Determine the phase angle between the voltage and current and the RMS current when the frequency is 1000Hz
References
Asmar, N.H., 2016. Partial differential equations with Fourier series and boundary value problems. Courier Dover Publications.
Gu, X., Jin, X. and Zhou, Y., 2016. Basic principles of concrete structures. Springer Berlin Heidelberg.
Haward, R.N. ed., 2012. The physics of glassy polymers. Springer Science & Business Media.
Heydt, G.T., 2016. Thevenin’s theorem applied to the analysis of polyphase transmission circuits. IEEE Transactions on Power Delivery, 32(1), pp.72-77.
Horath, L., 2019. Fundamentals of materials science for technologists: properties, testing, and laboratory exercises. Waveland Press.
Mirceski, V., Komorsky-Lovric, S. and Lovric, M., 2007. Square-wave voltammetry: theory and application. Springer Science & Business Media, pp 32.
Penlidis, A., 2017. Water Soluble Polymers.
Shen, Y.L. and Chawla, N., 2001. On the correlation between hardness and tensile strength in particle reinforced metal matrix composites. Materials Science and Engineering: A, 297(1-2), pp.44-47.
Walsh, D.J., Higgins, J.S. and Maconnachie, A. eds., 2012. Polymer blends and mixtures (Vol. 89). Springer Science & Business Media.
Zhang, P., Ma, L., Fan, F., Zeng, Z., Peng, C., Loya, P.E., Liu, Z., Gong, Y., Zhang, J., Zhang, X. and Ajayan, P.M., 2014. Fracture toughness of graphene. Nature communications, 5, p.3782.
| Original Bolt | Replacement | |||||
| Test 1 | Test 2 | |||||
| Sample 1 | Sample 1 | Original Av | Rep Av | |||
| Position | RC | RC | Original | Replacement | ||
| a = 10mm | 52 | 47 | 10 | 50 | 10 | 46.66666667 |
| b = 20mm | 50 | 43 | 20 | 47.66666667 | 20 | 44.66666667 |
| c = 30mm | 40 | 38 | 30 | 39 | 30 | 38.66666667 |
| d = 40mm | 41 | 39 | 40 | 40.33333333 | 40 | 39 |
| Position | Sample 2 | Sample 2 | ||||
| a = 10mm | 50 | 46 | ||||
| b = 20mm | 45 | 43 | ||||
| c = 30mm | 35 | 33 | ||||
| d = 40mm | 38 | 36 | ||||
| Position | Sample 3 | Sample 3 | ||||
| a = 10mm | 48 | 47 | ||||
| b = 20mm | 48 | 48 | ||||
| c = 30mm | 42 | 45 | ||||
| d = 40mm | 42 | 42 | ||||