Introduction
A market-leading manufacturer of outdoor recreation clothing is looking to develop new products to expand its base to the Asian markets. The objective is to investigate the demand for outdoor recreation clothing products. Characteristics of current products are studied to achieve the desired purpose. The insights gathered will put the company in an excellent position to develop and price the upcoming products. A sample of 333 products on the market is used in the study. Interest variables include gender, clothing line, price, and country. Analyses to be conducted include descriptive and inferential statistics, all performed in Excel.
Analysis
1.0: Descriptive Statistics of Price by Gender
The table below presents the summary statistics of product prices by gender.
Table 1: Descriptive statistics of prices by gender
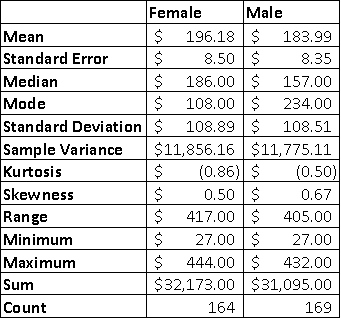
The average price of a female product is $196.18. However, the prices are spread out quite a bit (SD = $108.89) (Anderson et al., 2016). The cheapest female product costs $27.00, while the most expensive costs $444.00. On the other hand, the average price of a male product is $183.99, but the prices are spread quite a bit ($108.51). The cheapest male product costs $27.00, while the most expensive costs $405.
Based on the descriptive statistics above, it can be concluded that the average price of female products is higher than that of male products. Likewise, the prices for female products are slightly more spread out in the distribution than for males. The histograms below visualize the distribution of product prices by gender.
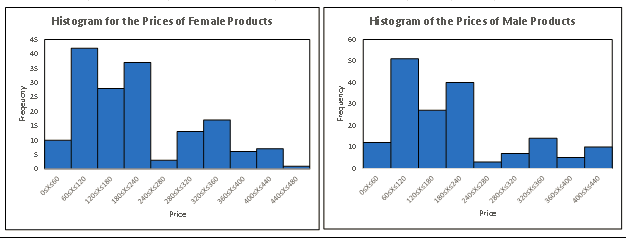
Figure 1: Histograms for the distributions of product prices by gender
Both histograms above have longer tails towards the right side of their peak, suggesting that the distributions of product prices for male and female customers are positively skewed (Black, 2019).
2.0: Descriptive Statistics of Price by Clothing Line
The table below presents the summary statistics of product prices by cloth line.
Table 2: Descriptive statistics of prices by cloth line.
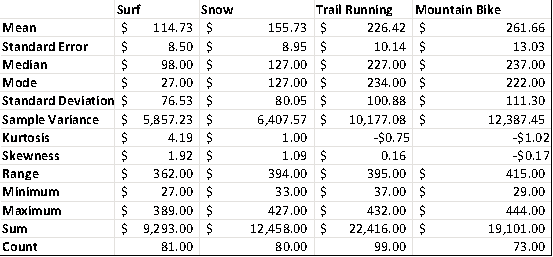
The average price of a surf cloth is $114.73. However, the prices of these clothes are dispersed quite a bit (SD = $76.53). The cheapest surf cloth costs $27.00, while the most expensive costs $389.00. On the other hand, the average price of a snow cloth is $155.73, but the prices are spread quite a bit (SD= $80.05). The cheapest snow product costs $33.00, while the most expensive costs $427. The average price of a trail-running cloth is $226.42, but there is relatively high variability in the prices of this product (SD= $100.88). The cheapest trail-running product costs $37.00, while the most expensive costs $432. Lastly, the average price of mountain bike cloth is $261.66, but the prices are spread quite a bit ($111.30). The cheapest mountain bike product costs $29.00, while the most expensive costs $444.
Based on the descriptive statistics above, it can be concluded that the average price differs by clothing line. Specifically, mountain bike products have the highest average, followed by trail running, snow, and surfing clothes. Likewise, the variability of prices differs by clothing line. The highest variability is observed in mountain bike products, followed by trail running, snow, and surfing clothes. The histograms below visualize the distribution of product prices by clothing line.
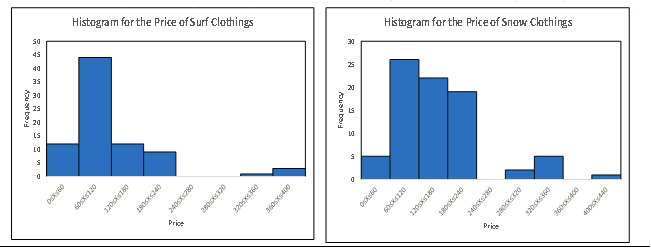
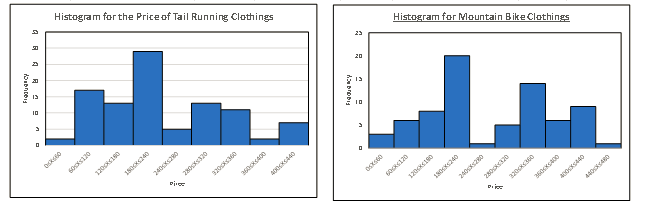
Figure 2: Histograms for the distributions of product prices by clothing line
All histograms above have longer tails towards the right side of their peak, suggesting that the distributions of product prices for the different clothing lines are positively skewed.
3.0: Descriptive Statistics of Price by Country
The table below presents the summary statistics of product prices by country.
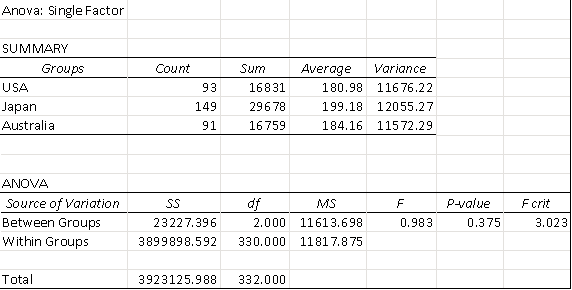
Table 3: Descriptive statistics of prices by country
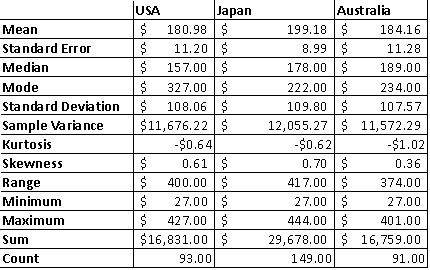
The average price of products in the USA is $180.98. However, the prices in this country are dispersed quite a bit (SD = $108.06). The cheapest product in the USA is $27.00, while the most expensive costs $427.00. On the other hand, the average price of a product in Japan is $199.18, but there is relatively high variability in the prices for products in this country (SD= $109.80). The product in Japan costs $27.00, while the most expensive costs $444.00. Lastly, the average product price in Australia is $184.16, but the prices are spread quite a bit ($107.57). The cheapest product in Australia costs $27.00, while the most expensive costs $401.
Based on the descriptive statistics above, it can be concluded that the average price differs by country. Specifically, products are costly in Japan and cheaper in the USA. Likewise, the variability of prices varies by country. The highest variability is observed in Japan, while the lowest is in Australia. The histograms below visualize the distribution of product prices by country.
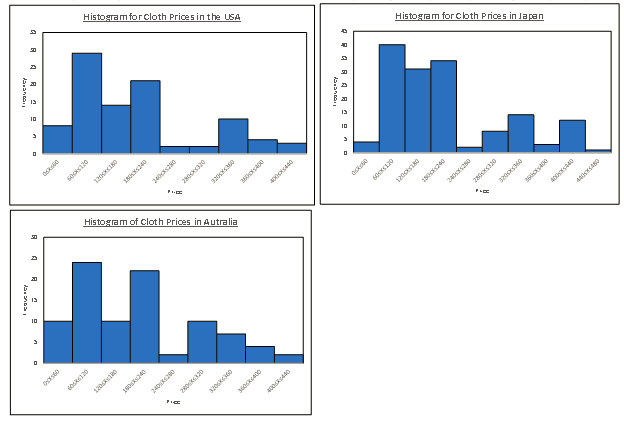
Figure 3: Histograms for the distributions of product prices by country
All histograms above have longer tails towards the right side of their peak, suggesting that the distributions of product prices for the different countries are positively skewed.
4.0: Hypothesis Test for Average Price Based on Gender
A right-tailed independent samples t-test assuming unequal variances was conducted to investigate whether the mean price of female products was higher than that of male products. The test was chosen because there is one dependent variable (price) and one independent variable (gender), with only two unrelated levels (male and female) (Der and Everitt, 2015). Also, the test is right-tailed because the interest is to investigate whether one mean is greater than the other (McKillup, 2011). The procedure followed in conducting the test is highlighted herewith.
Step 1: Hypotheses
The test’s null and alternative hypotheses are as follows;
Null hypothesis Ho: The mean price of female products is equal to that of male products. i.e., µfemale = µmale
Alternative hypothesis H1: The mean price of female products is greater than that of male products. i.e., µfemale > µmale
Step 2: Significance level
The test was conducted at the α = 0.05 level.
Step 3: Rejection Region
The test’s degrees of freedom are df = 331, while α = 0.05. Therefore, the critical value is tc = 1.649. Based on this critical value, the rejection region is as follows;
R=t.t>1.649
Step 4: Test Statistic
The table below presents the results of the test from Excel calculations.
Table 4: Right-tailed one-sample t-test results
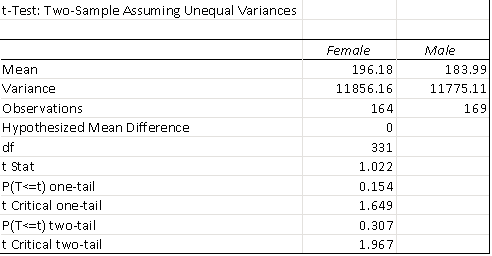
The test statistic is t = 1.022.
Step 5: Statistical Decision
The appropriate statistical decision is to not reject the null hypothesis because the test statistic (t = 1.022) is less than the critical value (Fc = 1.649) (Groebner, Shannon, and Fry, 2017).
Step 5: Conclusion in the context of the research problem
Since the null hypothesis is not rejected, it is concluded that there is not enough evidence to claim that the mean price of female products is higher than the mean price of male products.
5.0: Hypothesis Test for Average Price Based on Clothing Line
A one-way ANOVA test was performed to investigate whether there was a difference in the mean price of the four clothing lines. The test was chosen because there is one dependent variable (price) and one independent variable (cloth line), with more than two levels (surf, snow, trail running, and mountain bike). The procedure followed in conducting the test is highlighted herewith.
Step 1: Hypotheses
The test’s null and alternative hypotheses are as follows;
Null hypothesis Ho: The mean price is the same for all four cloth lines. i.e., µsurf = µsnow= µtrail running = µmountain bike
Alternative hypothesis H1: At least one of the means is different.
Step 2: Significance level
The test was conducted at the α = 0.05 level.
Step 3: Rejection Region
The test’s degrees of freedom are df = (3, 329), while α = 0.05. Therefore, the critical value is Fc = 2.632. Based on this critical value, the rejection region is as follows;
R=F:F>2.632
Step 4: Test Statistic
The table below presents the results of the one-way ANOVA from Excel calculations.
Table 5: one-way ANOVA results
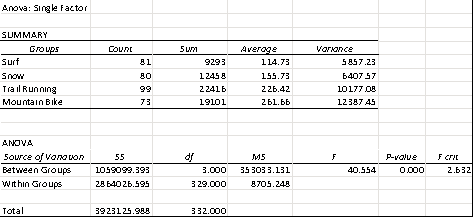
The test statistic is F = 40.554.
Step 5: Statistical Decision
The appropriate statistical decision is to reject the null hypothesis because the test statistic (F = 40.554) is greater than the critical value (tc = 2.632).
Step 5: Conclusion in the context of the research problem
Since the null hypothesis is rejected, it is concluded that there is enough evidence to claim that the mean price differs between the four cloth lines.
6.0: Hypothesis Test for Average Price Based on Country
A one-way ANOVA test was performed to investigate whether there was a difference in the mean price of products among the three countries. The test was chosen because there is one dependent variable (price) and one independent variable (country), with more than two levels (USA, Japan, and Australia) (Hand, 2018). The procedure followed in conducting the test is highlighted herewith.
Step 1: Hypotheses
The test’s null and alternative hypotheses are as follows;
Null hypothesis Ho: The mean price of products is the same for all three countries. i.e., µUSA = µJapan = µAustralia
Alternative hypothesis H1: At least one of the means is different.
Step 2: Significance level
The test was conducted at the α = 0.05 level.
Step 3: Rejection Region
The test’s degrees of freedom are df = (2, 330), while α = 0.05. Therefore, the critical value is Fc = 3.023. Based on this critical value, the rejection region is as follows;
R=F:F>3.023
Step 4: Test Statistic
The table below presents the results of the one-way ANOVA from Excel calculations.
Table 6: one-way ANOVA results
Step 5: Statistical Decision
The appropriate statistical decision is to not reject the null hypothesis because the test statistic (F = 0.983) is less than the critical value (Fc = 3.023).
Step 5: Conclusion in the context of the research problem
Since the null hypothesis is not rejected, it is concluded that there is not enough evidence to claim that the mean price of products differs between the three countries (Wasserman, 2013).
General Conclusion
The analysis aimed to study the demand for outdoor recreation clothing products to gather insights that can put the company in an excellent position to develop and price the upcoming products. Preliminary descriptive statistics analysis showed that product prices differed by gender, country, and clothing line. Specifically, the average cost of female products was higher than that of males, Japanese products were costlier than Australia and the USA, and mountain bike clothes were more expensive than all other clothing lines. Further analysis using inferential statistics showed that the difference in the mean prices for males and females was insignificant. Likewise, the difference in mean prices by countries was insignificant. Contrarily, the difference in mean price by clothing line was significant. The limitation of the study is that it investigates the market for new products based on price alone when several other factors influence demand, such as location, availability of similar products, and customer preferences. The company should consider such factors to understand the Asian market clearly.
Recommendations
Based on the findings above, it is recommended that;
The company should avoid over- or underpricing new products by pricing them on the same basis as the USA, Japan, and China.
The company should evaluate product sales based on current pricing to see what products sell the most. Products sold the most should be given priority in the new market.
The enterprise should stock male and female products equally, as there are no price differences, which could lead to variation in interested customers.
In the new market, mountain bike products should be priced higher, while surfing clothes should be priced the lowest as they are in the current market.
Sustainability
The company can help the environment and move towards sustainable development goals by prioritizing environmentally friendly practices such as the utilization of materials that can be recycled and the adoption of green manufacturing processes. The company can also use quality materials that improve comfort and durability while promoting environmental cleanliness. Lastly, the company can create a strong brand identity and produce customer-centered products to maintain their relevance in the market.
References
Anderson, D.R., Sweeney, D.J., Williams, T.A., Camm, J.D. and Cochran, J.J., 2016. Statistics for business & economics. Nelson Education
Black, K. 2019. Business statistics: For contemporary decision making. Hoboken: John Wiley & Sons.
Der, G., and Everitt, B. S. 2015. Essential statistics using SAS university edition. Cary: SAS Institute.
Groebner, D. F., Shannon, P. W., and Fry, P. C. 2017. Business statistics: A decision making approach. London, England: Pearson.
Hand, D. J. 2018. Statistics: A very short introduction. New York: Oxford University Press.
McKillup, S. 2011. Statistics explained: An introductory guide for life scientists. Cambridge, England: Cambridge University Press.
Wasserman, L. 2013. All of statistics: A concise course in statistical inference. Berlin, Germany: Springer Science & Business Media.