Introduction
In the present analysis we explore the dataset which is related to employee attrition. The dataset contains 35 variables. Moreover, in the given data there are 1470 rows of information.
In the present analysis we model the given data to predict Attrition of employees based on the given features,
Pre-processing
In the given data there are no missing data. In addition, it is also observed that 9 categorical variables and 26 numerical variables.
The variables “EmployeeCount”, “EmployeeNumber” do not have any impact on Attrition. Further, for the variable “Job Role” and “Education Field” there are 316 and 606 unique values. In addition, “Over 18” has only one unique value. Thus, the above 5 variables are dropped from further analysis.
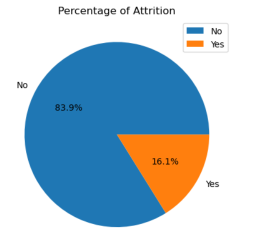
Analysis of the given data reveals that there has been an attrition of 16.1%. 83.9% of the employees are still working with the organization.
Since, the percentage of Attrition of the employees is less than 20% hence analysis of the given dataset may lead to oversampling. Thus, to check the imbalance, SMOTE function is used to create a balanced dataset.
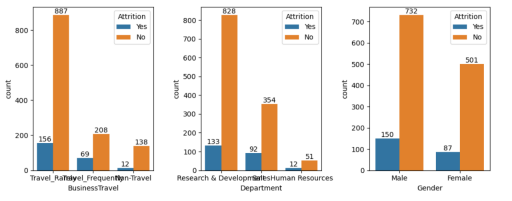
For the variable “Business Travel” there are only 12 attrition employees of the class non-travel. Similarly, in the variable Department there are 12 attrition employees of the class Human Resources. 150 males and 87 females have left the organization.
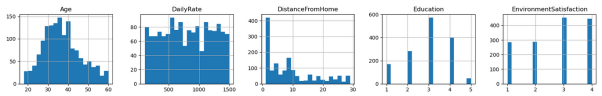
Age of the employees seems to be normally distributed. However, daily rate of the employees is approximately unimodal. The distance from home for the employees is right skewed. Thus, while most of the employees live near to the organization factory, there are few employees who come from some distance. Most of the employees have level 3 education. Very few employees have level 5 education. The environmental satisfaction for most of the employees is about level 3 and 4.
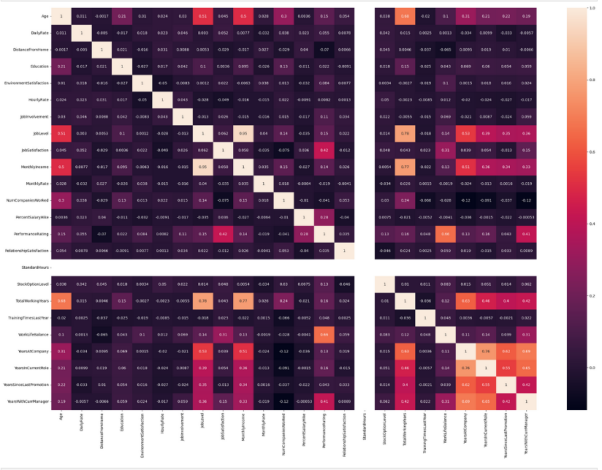
The correlation reveals that the following pairs are highly correlated (i) JobLevel and MonthlyIncome (ii) JobLevel and TotalWorkingYears (iii) MonthlyIncome and TotalWorkingYears (iv) YearsAtCompany and YearsInCurrentRole. Thus, the above variables are dropped from the actual modelling.
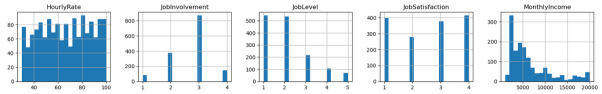
The hourly rate of the employees is approximately uniform. Thus, the employees receive from less than 40 till 100 per hour. Moreover, it can be observed that the Monthly income of the employees is right skewed. Satisfaction of the employees is again uniform.
Prior to the modelling process all categorical variables are converted to numerical variables through factorisation. This, is necessary for logistic regression modelling.
:The dataset has been split in a ratio of 70:30 for train and test.
Analysis
The given dataset has been modelled using Logistic Regression and Random Forest
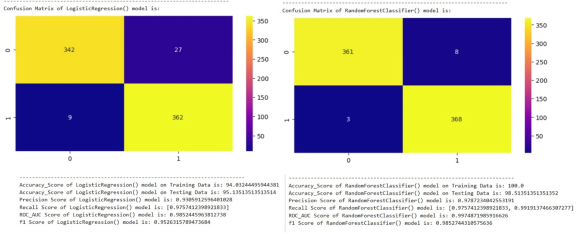
From the analysis it is observed that the accuracy on the test set for Logistic regression and random forest models are 95.14% and 98.13% respectively. Similarly, it is observed that the precision, recall and f1 score for logistic regression model is 93.06%, 97.57% and 95.26% respectively. Further, the precision, recall and f1 score for random forest model is 97.87%, 99.19% and 98.53% respectively.
Conclusion
Thus, Attrition of the employees can best be predicted using the Random Forest classifier model.