Introduction
Language is the considered as the means for communication for the members in a society. In the absence of language it is very difficult to communicate with each other and the human interaction would have been minimal (Pinker & Ackendoff, 2005). It has been argued that the relationship between the language and communication in a society. (SIRBU, 2015) argued language “as tool of communication among the members of a society, language is influenced by the very society where it functions”.
The study of language has been one of the most researched topic among the scholars and it is very important to study the language also. According to (Zarie & Esfandiari, 2008) language helps to make the both teaching and learning more effective. In the absence of the common language it is very difficult to pass the knowledge and also expression one’s views. Furthermore, language also works as the bridge between one generation and another, where one generation transfer knowledge to another generation and so on (Fay et al., 2018) .
There has been many research in this area and various research scholars. One of the most relevant research was conducted by (Bishop & Adams, 1991) using several language assessments. Findings from the previous research have shown that the control group were comparatively better than the SLI group. There was not significant correlation between self-reported linguistic ability and the task performance based on communication, which indicates no relationship between language and communication.
Research Questions:
Is there a correlation between language and communication?
Hypothesis:
Current research will be focused on testing the following hypothesis
Hypothesis 1
If our hypothesis is supported there will be a positive correlation between producer language ability and communication effectiveness
Hypothesis 2
If our hypothesis is supported there will be a positive correlation between receiver language ability and interpretation accuracy
Method
In this section the research methods used for the current study along with the data collection has been explained. The primary data was collected from the students of UWA. The data was collected from 709 students where around 69 % of the participants were female and around 30 % were male, rest of the participants do not disclose their gender. In terms of age, the mean age of the participants is 20.9 which is as expected as all of them were students.
The data collection purpose, two different tests were done. The first is the language ability test(MRehfeld & Padgett, 2018). This includes 4 categories namely lexical/semantic, syntactic, supralinguistic and pragmatic category. There were total 128 items and the response for each item were cumulated to calculate the overall language ability score. In this task the value of the language ability task lies between 0 and 128.
The second task given was the Non-interactive communication task(Rogers, Fay, & Maybery, 2013). For this test, two different tasks were prepared namely the Producer Task and the Receiver task and the students were randomly given the task. However one participant was given only one task. For the Producer task, the participants were asked to write a short description on the shapes where they were shown arrangement of 18 tangrams. The producer task was used to measure another variable “communication effectiveness”, based on the how accurate Receivers were in identifying the intended shape with the description given by the Producer. This was measured in terms of percentage.
On the other hand the receivers were shown the description given by the producers and were asked to select the shape as per their understanding from the given description. Based on the shape selection, the receivers were given the interpretation accuracy score. This was also given in the percentage.
Results
The findings from the data analysis are shown in the current section.
Descriptive Statistics
For the descriptive statistics the mean, standard deviation, minimum and the maximum value has been calculated and are presented in the table below.
| Mean | SD | Lowest | Highest | |
| Producer Language Ability | 96.9 | 10.1 | 60 | 166 |
| Receiver Language Ability | 96.1 | 10.3 | 65 | 119 |
| Producer Communication Effectiveness | 0.52 | 0.12 | 0.15 | 0.78 |
| Receiver interpretation accuracy | 0.51 | 0.14 | 0.11 | 0.83 |
Table 1 The descriptive results for Receiver and Producers
The variables shown in the above figure were calculated as follows:
Language Ability Scores
Correct responses to items on each of the CASL-2 subscales were added together to create an overall language ability score for each participant, range 0-128. In the above table you have descriptive statistics for the language ability of those in the producer and those in the receiver conditions.
Producer Communication Effectiveness
Producer communication effectiveness scores were calculated as the percentage of correct shape selections receivers made when they were they were presented with that producer’s shape descriptions, out of 54 trials.
Receiver Interpretation Accuracy
Receiver interpretation accuracy scores were calculated as the percentage of correct shape selections by receivers out of 54 trials.
Inferential analysis
The findings from the inferential analysis is discussed in the current section. As already mentioned the correlation analysis is performed and both the numerical and the graphical presentation of the correlation is presented.
| Correlation Matrix | |||||||
| Language_Ability_Score | |||||||
| Communication_Ability_Score | Pearson’s r | 0.208 | — | ||||
| p-value | < .001 | — | |||||
Table 2 Correlation between Language ability score and communication ability score (Producer)
The results from the correlation suggests that the degree of freedom for this case is 380 as there are total 382 data points for producers. The correlation coefficient is 0.208 with p value 0.001. This indicates that the correlation is weak.
| Correlation Matrix | |||||||
| Communication_Ability_Score | |||||||
| Language_Ability_Score | Pearson’s r | 0.341 | |||||
| p-value | < .001 | ||||||
Table 3 Correlation between Language ability score and communication ability score (Producer)
The results from the correlation suggests that the degree of freedom for this case is 325 as there are total 327 data points for producers. The correlation coefficient is 0.341 with p value 0.001. This indicates that the correlation is moderate.
Hypothesis 1
If our hypothesis is supported there will be a positive correlation between producer language ability and communication effectiveness.
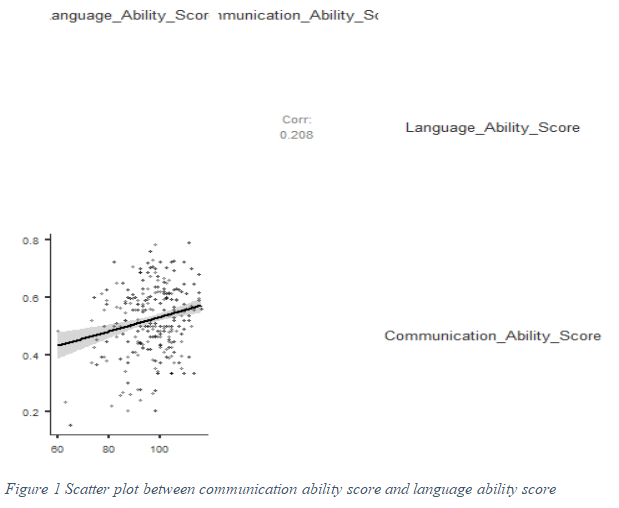
Figure 1 Scatter plot between communication ability score and language ability score
r (380) = 0.208, p < 0.001
There is a correlation between producer language ability and communication effectiveness. The r value is 0.208, so, it can be conclude that the correlation is weak. Since the p value is less than 0.05, so the correlation is significant at 95 % confidence interval. Also, the r value is positive, there is positive correlation between producer language ability and communication effectiveness
Hypothesis 2
If our hypothesis is supported there will be a positive correlation between receiver language ability and interpretation accuracy
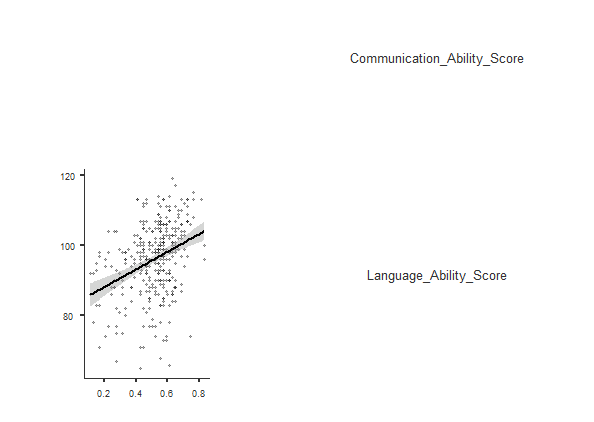
r (325) = 0.341 , p < 0.001
there is a positive correlation between receiver language ability and interpretation accuracy. Since the correlation value is 0.341, the correlation is moderate and also significant. Since the correlation is positive and significant, it support our hypothesis
Figure 2 Scatter plot between interpretation accuracy and language ability score
Discussions
The main objective of the current research was to examine the relationship between the language ability communications. The findings from the descriptive statistics show that the mean language ability score for the producer and the receivers are 96.9 and 96.1 respectively. There is not much difference between the mean value for both the groups and the Standard deviation for the producer is 10.1 whereas for receiver it is 10.3. The standard deviation which is used to measure the dispersion in the data set, indicates that there is higher variation in the score among the participants. This can also be interpreted from the minimum and the maximum value of the language ability test for both the groups.
Futhermore, the mean value of the producer communication effectiveness is 0.52 or 52 %. This indicates that on an average the participants in the producer group were able to explain 52 % of the shapes correctly to the receiver group. In other words, the receiver group were able to correctly identify the shape of the items based on the description given by the producers. In addition, the receiver interpretation accuracy of 0.51 indicates that 51 % the receivers were able to correctly identify the shape given the description.
In terms of correlation, there is positive correlation between the language ability score and the communication effective as well as the interpretation accuracy. However the correlation is weak for language and communication effectiveness. This indicates that language ability score and the communication effectiveness are not strongly related. On the other hand the language ability score and the interpretation score are moderately related. This implies that language is more important for those who provide the information. For example, the good language ability of a teacher is important, who is the producer rather than the receiver who just have to understand. However in this case the results shows strong relation between receiver and the language ability. In the previous research by (Bishop & Adams, 1991) there was also no relationship between conversation ability and the communication performance which was different from the current results. Further analysis can be conducted by giving different language test for receiver and producer unlike the same in this case. This can provide a much robust answer to this research problem.
References
Bishop, D. V, & Adams, C. (1991). What do referential communication tasks measure? A study of children with specific language impairment. Psycholinguistics, 12(2), 199–215.
Fay, N., T M, E., Tylén, K., Fusaroli, R., Walker, B., & Garrod, S. (2018). Applying the cultural ratchet to a social artefact: The cumulative cultural evolution of a language game. Evolution and Human Behavior, 39(3), 300–309.
MRehfeld, D., & Padgett, R. N. (2018). Test Review: Comprehensive Assessment of Spoken Language. Journal of Psychoeducational Assessment, 2.
Pinker, S., & Ackendoff, R. (2005). The faculty of language: what’s special about it?. Cognition, 95(2), 201–236.
Rogers, S. L., Fay, N., & Maybery, M. (2013). Audience design through social interaction during group discussion. PloS One, 8(2).
SIRBU, A. (2015). THE SIGNIFICANCE OF LANGUAGE AS A TOOL OF COMMUNICATION. Naval Academy Scientific Bulletin, 8(2).
Zarie, G. R., & Esfandiari, M. A. (2008). The effect of Constructivist vs Conventinal Teaching on Reading Comprehension. The Social Sciencies, 3(8), 606–610.